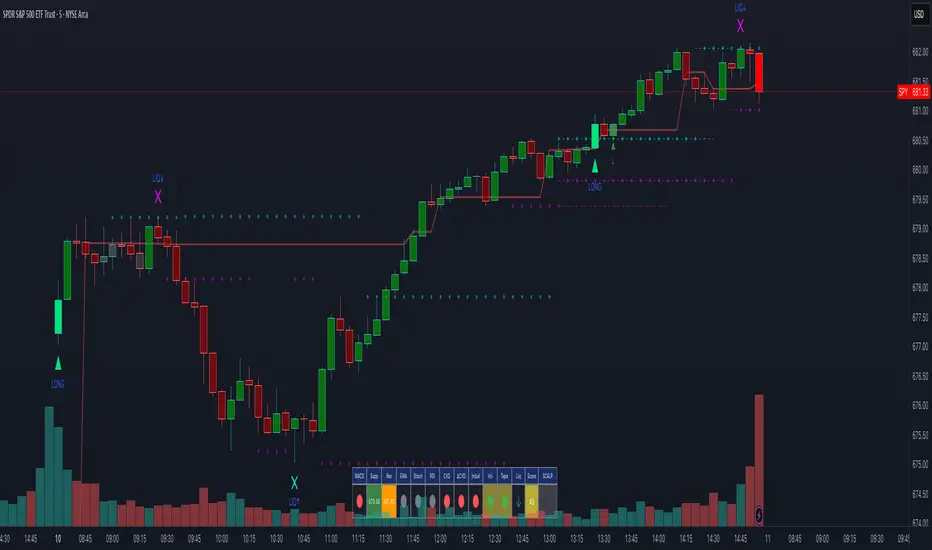
Wick Size in USD with 10-Bar AverageWick Size in USD with 10-Bar Average
Version: 1.0
Author: QCodeTrader
🔍 Overview
This indicator converts the price wicks of your candlestick chart into USD values based on ticks, providing both raw and smoothed data via a 10-bar simple moving average. It helps traders visualize the monetary impact of price extremes, making it easier to assess volatility, potential risk, and plan appropriate stop loss levels.
⚙️ Key Features
Tick-Based Calculation:
Converts wick sizes into ticks (using a fixed tick size of 0.01, typical for stocks) and then into USD using a customizable tick value.
10-Bar Moving Average:
Smooths out the wick values over the last 10 bars, giving you a clearer view of average wick behavior.
Bullish/Bearish Visual Cues:
The chart background automatically highlights bullish candles in green and bearish candles in red for quick visual assessment.
Stop Loss Optimization:
The indicator highlights long wick sizes, which can help you set more accurate stop loss levels. Even when the price moves in your favor, long wicks may indicate potential reversals—allowing you to account for this risk when planning your stop losses.
User-Friendly Customization:
Easily adjust the USD value per tick through the settings to tailor the indicator to your specific instrument.
📊 How It Works
Wick Calculation:
The indicator calculates the upper and lower wicks by measuring the distance between the candle’s high/low and its body (open/close).
Conversion to Ticks & USD:
These wick sizes are first converted from price points to ticks (dividing by a fixed tick size of 0.01) and then multiplied by the user-defined tick value to convert the measurement into USD.
Smoothing Data:
A 10-bar simple moving average is computed for both the upper and lower wick values, providing smoothed data that helps identify trends and deviations.
Visual Representation:
Columns display the raw wick sizes in USD.
Lines indicate the 10-bar moving averages.
Background Color shifts between green (bullish) and red (bearish) based on candle type.
⚡ How to Use
Add the Indicator:
Apply it to your chart to begin visualizing wick sizes in monetary terms.
Customize Settings:
Adjust the Tick Value in USD in the settings to match your instrument’s tick value.
(Note: The tick size is fixed at 0.01, which is standard for many stocks.)
Optimize Your Stop Loss:
Analyze the raw and averaged wick values to understand volatility. Long wicks—even when the price moves in your favor—may indicate potential reversals. This insight can help you set more accurate stop loss levels to protect your gains.
Analyze:
Use the indicator’s data to gauge market volatility and assess the significance of price movements, aiding in more informed trading decisions.
This indicator is perfect for traders looking to understand the impact of extreme price movements in monetary terms, optimize stop loss levels, and effectively manage risk across stocks and other instruments with similar tick structures.
Tìm kiếm tập lệnh với "stop loss"
Flux Charts - S&D Automation💎 GENERAL OVERVIEW
The MTF Supply & Demand Zones (S&D) Automation is a powerful and versatile tool designed to help traders rigorously test their trading strategies against historical market data. With various advanced settings, traders can fine-tune their strategies, assess performance, and identify key improvements before deploying in live trading environments. This tool offers a wide range of configurable settings, explained within this write-up.
Features of the new S&D Automation:
Step By Step : Configure your strategy step by step, which will allow you to have OR & AND logic in your strategies.
Highly Configurable : Offers multiple parameters for fine-tuning trade entry and exit conditions.
Multi-Timeframe Analysis : Allows traders to analyze multiple timeframes simultaneously for enhanced accuracy.
Provides advanced stop-loss, take-profit, and break-even settings.
Incorporates Supply & Demand Zone conditions, with settings like Sensitivity, Zone Invalidation, Minimum Zone Width & Minimum Zone Length settings for refined strategy execution.
🚩 UNIQUENESS
The S&D Automation stands out from conventional backtesting tools due to its unparalleled flexibility, precision, and advanced trading logic integration. Key factors that make it unique include:
✅ Comprehensive Strategy Customization – Unlike traditional backtesters that offer basic entry and exit conditions, S&D Automation provides a highly detailed parameter set, allowing traders to fine-tune their strategies with precision.
✅ Multi-Timeframe Supply & Demand Zones – This is the first-ever tool that allows traders to backtest Supply & Demand zones on multiple timeframes.
✅ Customizable Take-Profit Conditions – Offers various methods to set take-profit exits, including using core features from Supply & Demand Zones, and fixed exits like ATR, % change or price change, enabling traders to tailor their exit strategies to specific market behaviors.
✅ Customizable Stop-Loss Conditions – Provides several ways to set up stop losses, including using concepts from Supply & Demand Zones and trailing stops or fixed exits like ATR, % change or price change, allowing for dynamic risk management tailored to individual strategies.
✅ Integration of External Indicators – Allows the inclusion of other indicators or data sources from TradingView for creating strategy conditions, enabling traders to enhance their strategies with additional insights and data points.
By integrating these advanced features, S&D Automation ensures that traders can rigorously test and optimize their strategies with great accuracy and efficiency.
📌 HOW DOES IT WORK ?
The first setting you will want to set it the pyramiding setting. This setting controls the number of simultaneous trades in the same direction allowed in the strategy. For example, if you set it to 1, only one trade can be active in any time, and the second trade will not be entered unless the first one is exited. If it is set to 2, the script will handle both of them at the same time. Note that you should enter the same value to this pyramiding setting, and the pyramiding setting in the "Properties" tab of the script for this to work.
You can enable and set a backtesting window that will limit the entries to between the start date & end date.
Then, you can enter your desired settings for Supply & Demand Zones. You can also enable and set up to 3 timeframes, which you can use later on when customizing your strategies enter / exit conditions.
Entry Conditions
From the "Long Conditions" or the "Short Conditions" groups, you can set your position entry conditions. For settings like "initial capital" or "order size", you can open the "Properties" tab, where these are handled.
The S&D Automation can use the following conditions for entry conditions :
1. Demand Zone
Detection: Triggered when a Demand Zone forms or is detected
Retest: Triggered when price retests a Demand Zone. A retest is confirmed when a candle enters a Demand Zone and closes outside of it.
2nd Retest: Triggered when price retests a Demand Zone for the second time. A retest is confirmed when a candle enters a Demand Zone and closes outside of it.
3rd Retest: Triggered when price retests a Demand Zone for the third time. A retest is confirmed when a candle enters a Demand Zone and closes outside of it.
Retracement: Triggered when price touches a Demand Zone
Break: Triggered when a Demand Zone is invalidated by candle close or wick, depending on the user's input.
2. Supply Zone
Detection: Triggered when a Supply Zone forms or is detected
Retest: Triggered when price retests a Supply Zone. A retest is confirmed when a candle enters a Supply Zone and closes outside of it.
2nd Retest: Triggered when price retests a Supply Zone for the second time. A retest is confirmed when a candle enters a Supply Zone and closes outside of it.
3rd Retest: Triggered when price retests a Supply Zone for the third time. A retest is confirmed when a candle enters a Supply Zone and closes outside of it.
Retracement: Triggered when price touches a Supply Zone
Break: Triggered when a Supply Zone is invalidated by candle close or wick, depending on the user's input.
3. Any Zone
Detection: Triggered when any Supply or Demand Zone forms or is detected
Retest: Triggered when price retests any Supply or Demand Zone. A retest is confirmed when a candle enters any Supply or Demand Zone and closes outside of it.
2nd Retest: Triggered when price retests any Supply or Demand Zone for the second time. A retest is confirmed when a candle enters any Supply or Demand Zone and closes outside of it.
3rd Retest: Triggered when price retests any Supply or Demand Zone for the third time. A retest is confirmed when a candle enters any Supply or Demand Zone and closes outside of it.
Retracement: Triggered when price touches any Supply or Demand Zone
Break: Triggered when any Supply or Demand Zone is invalidated by candle close or wick, depending on the user's input.
🕒 TIMEFRAME CONDITIONS
The S&D Automation supports Multi-Timeframe (MTF) features, just like the Supply & Demand indicator. When setting an entry condition, you can also choose the timeframe.
To set up MTF conditions, navigate to the 'Timeframes' section in the settings, select your desired timeframes, and enable them. You can choose up to three timeframes.
Once you've selected your timeframes, you can use them in your strategy. When setting long and short entry/exit conditions, you can choose from Timeframe 1, Timeframe 2, or Timeframe 3.
External Conditions
Users can use external indicators on the chart to set entry conditions.
The second dropdown in the external condition settings allows you to choose a conditional operator to compare external outputs. Available options include:
Less Than or Equal To: <=
Less Than: <
Equal To: =
Greater Than: >
Greater Than or Equal To: >=
The position entry conditions work like this ;
Each side has 5 S&D Zone conditions and 1 Source condition. Each condition can be enabled or disabled using the checkbox on the left side of them.
The next selection is the alert type, which you can select between "Detection", "Retest", "Retracement" or "Break".
You can select which timeframe this condition should work on from Timeframe 1, 2, or 3. If you select "Any Timeframe", the condition will work for all timeframes.
Lastly select the step of this condition from 1 to 6.
The Source Condition
The last condition on each side is a source condition that is different from the others. Using this condition, you can create your own logic using other indicators' outputs on your chart. For example, suppose that you have an EMA indicator in your chart. You can have the source condition to something like "EMA > high".
The Step System
Each condition has a step number, and conditions are in topological order based on them.
The conditions are executed step by step. This means the condition with step 2 cannot be executed before the condition with step 1 is executed.
Conditions with the same step numbers have "OR" logic. This means that if you have 2 conditions with step 3, the condition with step 4 can trigger after only one of the step 3 conditions is executed.
➕ OTHER ENTRY FEATURES
The S&D Automation allows traders to choose when to execute trades and when not to execute trades.
1. Only Take Trades
This setting lets users specify the time period when their strategy can open or execute trades.
2. Don't Take Trades
This setting lets users specify time periods when their strategy can't open or execute trades.
↩️ EXIT CONDITIONS
1. Exit on Opposite Signal
When enabled, a long position will close when short entry conditions are met, and a short position will close when long entry conditions are met.
2. Exit on Session End
When enabled, positions will be closed at the end of the trading session.
📈 TAKE PROFIT CONDITIONS
There are several methods available for setting take profit exits and conditions.
1. Entry Condition TP
Users can use entry conditions as triggers for take-profit exits. This setting can be found under the long and short exit conditions.
2. Fixed TP
Users can set a fixed TP for exits. This setting can be found under the long and short exit conditions. Users can choose between the following:
Price: This method triggers a TP exit when price reaches a specified level. For example, if you set the Price TP to 10 and buy NASDAQ:TSLA at $190, the trade will automatically exit when the price reaches $200 ($190 + $10).
Ticks: This method triggers a TP exit when price moves a specified number of ticks.
Percentage (%): This method triggers a TP exit when price moves a specified percentage.
ATR: This method triggers a TP exit based on a specified multiple of the Average True Range (ATR).
📉 STOP LOSS CONDITIONS
There are several methods available for setting stop-loss exits and conditions.
1. Entry Condition SL
Users can use entry conditions as triggers for stop-loss exits. This setting can be found under the long and short exit conditions.
2. Fixed SL
Users can set a fixed SL for exits. This setting can be found under the long and short exit conditions. Users can choose between the following:
Price: This method triggers a SL exit when price reaches a specified level. For example, if you set the Price SL to 10 and buy NASDAQ:TSLA at $200, the trade will automatically exit when the price reaches $190 ($200 - $10).
Ticks: This method triggers a SL exit when price moves a specified number of ticks.
Percentage (%): This method triggers a SL exit when price moves a specified percentage.
ATR: This method triggers a SL exit based on a specified multiple of the Average True Range (ATR).
3. Trailing Stop
An explanation & example for the trailing stop feature is present on the write-up within the next section.
Exit conditions have the same logic of constructing conditions like the entry ones. You can construct a Take-Profit Condition & a Stop-Loss Condition. Note that the Take-Profit condition will only work if the position is in profit, regardless of if it's triggered or not. The same applies for the Stop-Loss condition, meaning that it will only work if the position is in loss.
You can also set a Fixed TP & Fixed SL based on the price movement after the position is entered. You have options like "Price", "Ticks", "%", or "Average True Range". For example, you can set a Fixed TP like "5%", and the position will be entered once it moves 5% up in a long position.
Trailing Stop
For the Fixed SL, you also have a "Trailing" stop option, for which you can set its activation level as well. The Trailing stop activation level and its value are expressed in ticks. Check this scenario for an example :
We have a ticker with a tick value of $1. Our Trailing Stop is set to 10 ticks, and the activation level is set to 30 ticks.
We buy 1 contract when the price is $100.
When the price becomes $110, we are in $10 (10 ticks) profit and the trailing stop is now activated.
The current price our stop's on is $110 - $30 (30 ticks), which is the level of $80.
The trailing stop will only move if the price moves up the highest high the price has been after we entered the position.
Let's suppose that price moves up $40 right after our trailing stop is activated. The price will now be $150, and our trailing stop will sit on $150 - $30 (30 ticks) = $120.
If the price is down the $120 level, our stop loss will be triggered.
There is also a "Hard SL" option designed for a backup stop-loss when trailing stops are enabled. You can enable & set this option and if the price goes down before our trailing stop even activates, the position will be exited.
You can also move stop-loss to the break-even (entry price of the position) after a certain profit is achieved using the last setting of the exit conditions. Note that for this to work, you must have a Fixed SL set-up.
➕ OTHER EXIT FEATURES
1. Move Stop Loss to Breakeven
This setting allows the strategy to automatically move the SL to Breakeven (BE) when the position is in profit by a certain amount. Users can choose between the following:
Price: This method moves the SL to BE when price reaches a specified level.
Ticks: This method moves the SL to BE when price moves a specified number of ticks.
Percentage (%): This method moves the SL to BE when price moves a specified percentage.
ATR: This method moves the SL to BE when price moves a specified multiple of the Average True Range (ATR).
Example Entry Scenario
To give an example , check this scenario; out conditions are :
LONG CONDITIONS
Demand Zone Detection, Step 1
Supply Zone Retest, Step 2
Demand Zone Break, Step 2
open > close, Step 3
First, the strategy needs to detect a Demand Zone Detection in order to start working.
After it's detected, now it's looking for either a Supply Zone Retest, or a Demand Zone Break to proceed to the next step, the reason for this is that they both have the same step number.
After one of them is detected, the strategy will consistently check candlesticks for the condition open > close. If a bullish candlestick occurs, a long position will be entered.
⏰ ALERTS
This indicator uses TradingView's strategy alert system. All entries and exits will be sent as an alert if configured. It's possible to further customize these alerts to your liking. For more information check TradingView's strategy alert customization page : www.tradingview.com
⚙️ SETTINGS
1. Backtesting Settings
Pyramiding: Controls the number of simultaneous trades allowed in the strategy. This setting must have the same value that is entered on the script's properties tab on the settings pane.
Enable Custom Backtesting Period: Restricts backtesting to a specific date range.
Start & End Time Configuration: Define precise start and end dates for historical analysis.
2. General Configuration
Detection Method: There are two detection methods you can choose from for identifying Supply & Demand Zones. Both methods aim to identify key areas where price is likely to react, but they do so using different approaches. Traders can choose the method that aligns with their trading style and time horizon.
Sensitivity: The Sensitivity setting allows traders to adjust how aggressively the script identifies supply and demand zones when using the Momentum Detection Method. This setting directly impacts the threshold for detecting zones when using the momentum detection method.
Zone Invalidation: The Zone Invalidation setting determines how supply and demand zones are invalidated.
Wick -> A zone is invalidated if a candle’s wick goes below a demand zone or above a supply zone.
Close -> A zone is invalidated if a candle closes below a demand zone or above a supply zone.
Zone Visibility Range: The Zone Visibility Range setting controls how far from the current price supply and demand zones are displayed on the chart. It helps traders focus on relevant zones while avoiding clutter from distant or less impactful areas.
Minimum Zone Width: The Minimum Zone Width setting defines the smallest size a supply or demand zone must have to be displayed on the chart. It uses the Average True Range (ATR) as a reference to ensure zones are proportionate to current market volatility.
Minimum Zone Length: The Minimum Zone Length setting determines the minimum number of bars a supply or demand zone must span to be displayed on the chart. This setting helps filter out short-lived or insignificant zones, ensuring only meaningful areas of supply or demand are highlighted.
3. Multi-Timeframe Analysis
Enable Up to Three Timeframes: Select and analyze trades across multiple timeframes.
4. Entry Conditions for Long & Short Trades
Multiple Conditions (1-6): Configure up to six independent conditions per trade direction.
Condition Types: Options include Detection, Retest, 2nd Retest, 3rd Retest, Retracement, and Break.
Timeframe Specification: Choose between "Any Timeframe", "Timeframe 1", "Timeframe 2", or "Timeframe 3".
Trade Execution Filters: Restrict trades within specific trading sessions.
5. Exit Conditions for Long & Short Trades
Exit on Opposite Signal: Automatically exit trades upon opposite trade conditions.
Exit on Session End: Closes all positions at the end of the trading session.
Multiple Take-Profit (TP) and Stop-Loss (SL) Configurations:
TP/SL based on % move, ATR, Ticks, or Fixed Price.
Hard SL option for additional risk control.
Move SL to BE (Break Even) after a certain profit threshold.
Flux Charts - PAT Automation💎 GENERAL OVERVIEW
The PAT Automation is a powerful and versatile tool designed to help traders rigorously test their trading strategies against historical market data. With an array of advanced settings, traders can fine-tune their strategies, assess performance, and identify key improvements before deploying in live trading environments. This backtester offers a wide range of configurable settings, explained within this write-up.
Features of the PAT Automation:
Step By Step : Configure your strategy step by step, which will allow you to have OR & AND logic in your strategies.
Highly Configurable : Offers multiple parameters for fine-tuning trade entry and exit conditions.
Multi-Timeframe Analysis : Allows traders to analyze multiple timeframes simultaneously for enhanced accuracy.
Provides advanced stop-loss, take-profit, and break-even settings.
Incorporates volume-based conditions, liquidity grabs , order blocks , market structures and fair value gaps for refined strategy execution.
🚩 UNIQUENESS
The PAT Automation stands out from conventional backtesting tools due to its unparalleled flexibility, precision, and advanced trading logic integration. Key factors that make it unique include:
✅ Comprehensive Strategy Customization – Unlike traditional backtesters that offer basic entry and exit conditions, PAT Automation provides a highly detailed parameter set, allowing traders to fine-tune their strategies with precision.
✅ Multi-Timeframe Price Action Features – This is the first-ever tool that allows traders to backtest price action with multi-timeframe features such as Fair Value Gaps (FVGs), Inversion Fair Value Gaps (IFVGs), Order Blocks & Breaker Blocks.
✅ Customizable Take-Profit Conditions – Offers various methods to set take-profit exits, including using core features from price action, and fixed exits like ATR, % change or price change, enabling traders to tailor their exit strategies to specific market behaviors.
✅ Customizable Stop-Loss Conditions – Provides several ways to set up stop losses, including using concepts from price action and trailing stops or fixed exits like ATR, % change or price change, allowing for dynamic risk management tailored to individual strategies.
✅ Integration of External Indicators – Allows the inclusion of other indicators or data sources from TradingView for creating strategy conditions, enabling traders to enhance their strategies with additional insights and data points.
By integrating these advanced features, PAT Automation ensures that traders can rigorously test and optimize their strategies with great accuracy and efficiency.
📌 HOW DOES IT WORK?
The first setting you will want to set it the pyramiding setting. This setting controls the number of simultaneous trades in the same direction allowed in the strategy. For example, if you set it to 1, only one trade can be active in any time, and the second trade will not be entered unless the first one is exited. If it is set to 2, the script will handle both of them at the same time. Note that you should enter the same value to this pyramiding setting, and the pyramiding setting in the "Properties" tab of the script for this to work.
For deep backtesting, you can set "Max Distance To Last Bar" to "Unlimited". If you encounter any memory issues, try decreasing this setting to a lower value.
You can enable and set a backtesting window that will limit the entries to between the start date & end date.
Then, you can enter your desired settings to Price Action features like FVGs, IFVGs, Order Blocks, Breaker Blocks, Liquidity Grabs, Market Structures, EQH & EQL and Volume Imbalances. You can also enable and set up to 3 timeframes, which you can use later on when customizing your strategies enter / exit conditions.
Entry Conditions
From the "Long Conditions" or the "Short Conditions" groups, you can set your position entry conditions. For settings like "initial capital" or "order size", you can open the "Properties" tab, where these are handled.
The PAT Automation can use the following conditions for entry conditions :
1. Order Block (OB)
Detection: Triggered when an Order Block forms or is detected
Retest: Triggered when price retests an Order Block. A retest is confirmed when a candle enters an Order Block and closes outside of it.
Retracement: Triggered when price touches an Order Block
Break: Triggered when an Order Block is invalidated by candle close or wick, depending on the user's input.
2. Breaker Block (BB)
Detection: Triggered when a Breaker Block forms or is detected
Retest: Triggered when price retests a Breaker Block. A retest is confirmed when a candle enters a Breaker Block and closes outside of it.
Retracement: Triggered when price touches a Breaker Block
Break: Triggered when a Breaker Block is invalidated by candle close or wick, depending on the user's input.
3. Fair Value Gap (FVG)
Detection: Triggered when an FVG forms or is detected
Retest: Triggered when price retests an FVG. A retest is confirmed when a candle enters an FVG and closes outside of it.
Retracement: Triggered when price touches an FVG
Break: Triggered when an FVG is invalidated by candle close or wick, depending on the user's input.
4. Inversion Fair Value Gap (IFVG)
Detection: Triggered when an IFVG forms or is detected
Retest: Triggered when price retests an IFVG. A retest is confirmed when a candle enters an IFVG and closes outside of it.
Retracement: Triggered when price touches an IFVG
Break: Triggered when an IFVG is invalidated by candle close or wick, depending on the user's input.
5. Break of Structure (BOS)
Detection: Triggered when a BOS forms or is detected
6. Change of Character (CHoCH)
Detection: Triggered when a CHoCH forms or is detected
7. Change of Character Plus (CHoCH+)
Detection: Triggered when a CHoCH+ forms or is detected
8. Volume Imbalance (VI)
Detection: Triggered when a Volume Imbalance forms or is detected
9. Equal High (EQH)
Detection: Triggered when an EQH is detected
10. Equal Low (EQL)
Detection: Triggered when an EQL is detected
11. Buyside Liquidity Grab
Detection: Triggered when a liquidity grab occurs at Buyside Liquidity (BSL).
12. Sellside Liquidity Grab
Detection: Triggered when a liquidity grab occurs at Sellside Liquidity (SSL).
🕒 TIMEFRAME CONDITIONS
The PAT Automation supports Multi-Timeframe (MTF) features, just like the Price Action Toolkit. When setting an entry condition, you can also choose the timeframe.
To set up MTF conditions, navigate to the 'Timeframes' section in the settings, select your desired timeframes, and enable them. You can choose up to three timeframes.
Once you've selected your timeframes, you can use them in your strategy. When setting long and short entry / exit conditions, you can choose from Timeframe 1, Timeframe 2, or Timeframe 3.
External Conditions
Users can use external indicators on the chart to set entry conditions.
The second dropdown in the external condition settings allows you to choose a conditional operator to compare external outputs. Available options include:
Less Than or Equal To: <=
Less Than: <
Equal To: =
Greater Than: >
Greater Than or Equal To: >=
The position entry conditions work like this ;
Each side has 5 Price Action conditions and 1 Source condition. Each condition can be enabled or disabled using the checkbox on the left side.
For Price Action Conditions, you can set a direction: "Any", "Bullish" or "Bearish".
Then a Price Action Feature, like "FVG" or "Order Block".
The last part of our constructed condition is the alert type, which you can select between "Detection", "Retest", "Retracement" or "Break".
Now you should have a constructed condition, which should look like "Bullish Order Block Retest".
You can select which timeframe should this condition work on from Timeframe 1, 2 or 3. If you select "Any Timeframe", the condition will work for all timeframes.
Lastly select the step of this condition from 1 to 6.
The Source Condition
The last condition on each side is a source condition that is different from the others. Using this condition, you can create your own logic using other indicators' outputs on your chart. For example, suppose that you have an EMA indicator in your chart. You can have the source condition to something like "EMA > high".
The Step System
Each condition has a step number, and conditions are in topological order based on them.
The conditions are executed step by step. This means the condition with step 2 cannot be executed before the condition with step 1 is executed.
Conditions with the same step numbers have "OR" logic. This means that if you have 2 conditions with step 3, the condition with step 4 can trigger after only one of the step 3 conditions is executed.
➕ OTHER ENTRY FEATURES
The PAT Automation allows traders to choose when to execute trades and when not to execute trades.
1. Only Take Trades
This setting lets users specify the time period when their strategy can open or execute trades.
2. Don't Take Trades
This setting lets users specify time periods when their strategy can't open or execute trades.
↩️ EXIT CONDITIONS
1. Exit on Opposite Signal
When enabled, a long position will close when short entry conditions are met, and a short position will close when long entry conditions are met.
2. Exit on Session End
When enabled, positions will be closed at the end of the trading session.
📈 TAKE PROFIT CONDITIONS
There are several methods available for setting take profit exits and conditions.
1. Entry Condition TP
Users can use entry conditions as triggers for take-profit exits. This setting can be found under the long and short exit conditions.
2. Fixed TP
Users can set a fixed TP for exits. This setting can be found under the long and short exit conditions. Users can choose between the following:
Price: This method triggers a TP exit when price reaches a specified level. For example, if you set the Price TP to 10 and buy NASDAQ:TSLA at $190, the trade will automatically exit when the price reaches $200 ($190 + $10).
Ticks: This method triggers a TP exit when price moves a specified number of ticks.
Percentage (%): This method triggers a TP exit when price moves a specified percentage.
ATR: This method triggers a TP exit based on a specified multiple of the Average True Range (ATR).
📉 STOP LOSS CONDITIONS
There are several methods available for setting stop-loss exits and conditions.
1. Entry Condition SL
Users can use entry conditions as triggers for stop-loss exits. This setting can be found under the long and short exit conditions.
2. Fixed SL
Users can set a fixed SL for exits. This setting can be found under the long and short exit conditions. Users can choose between the following:
Price: This method triggers a SL exit when price reaches a specified level. For example, if you set the Price SL to 10 and buy NASDAQ:TSLA at $200, the trade will automatically exit when the price reaches $190 ($200 - $10).
Ticks: This method triggers a SL exit when price moves a specified number of ticks.
Percentage (%): This method triggers a SL exit when price moves a specified percentage.
ATR: This method triggers a SL exit based on a specified multiple of the Average True Range (ATR).
3. Trailing Stop
An explanation & example for the trailing stop feature is present on the write-up within the next section.
Exit conditions have the same logic of constructing conditions like the entry ones. You can construct a Take-Profit Condition & a Stop-Loss Condition. Note that the Take-Profit condition will only work if the position is in profit, regardless of if it's triggered or not. The same applies for the Stop-Loss condition, meaning that it will only work if the position is in loss.
You can also set a Fixed TP & Fixed SL based on the price movement after the position is entered. You have options like "Price", "Ticks", "%", or "Average True Range". For example, you can set a Fixed TP like "5%", and the position will be entered once it moves 5% up in a long position.
Trailing Stop
For the Fixed SL, you also have a "Trailing" stop option, which you can set it's activation level as well. The Trailing stop activation level and it's value are expressed in ticks. Check this scenerio for an example :
We have a ticker with a tick value of $1. Our Trailing Stop is set to 10 ticks and activation level is set to 30 ticks.
We buy 1 contract when the price is $100.
When the price becomes $110, we are in $10 (10 ticks) profit and the trailing stop is now activated.
The current price our stop's on is $110 - $30 (30 ticks), which is the level of $80.
The trailing stop will only move if the price moves up the highest high the price has been after we entered the position.
Let's suppose that price moves up $40 right after our trailing stop is activated. The price will now be $150, and our trailing stop will sit on $150 - $30 (30 ticks) = $120.
If the price is down the $120 level, our stop loss will be triggered.
There is also a "Hard SL" option designed for a backup stop-loss when trailing stops are enabled. You can enable & set this option and if the price goes down before our trailing stop even activates, the position will be exited.
You can also move stop-loss to the break-even (entry price of the position) after a certain profit is achieved using the last setting of the exit conditions. Note that for this to work, you will need to have a Fixed SL set-up.
➕ OTHER EXIT FEATURES
1. Move Stop Loss to Breakeven
This setting allows the strategy to automatically move the SL to Breakeven (BE) when the position is in profit by a certain amount. Users can choose between the following:
Price: This method moves the SL to BE when price reaches a specified level.
Ticks: This method moves the SL to BE when price moves a specified number of ticks.
Percentage (%): This method moves the SL to BE when price moves a specified percentage.
ATR: This method moves the SL to BE when price moves a specified multiple of the Average True Range (ATR).
Example Entry Scenario
To give an example , check this scenario; out conditions are :
LONG CONDITIONS
Bullish Order Block Detection, Step 1
Bullish CHoCH Detection, Step 2
Bullish Volume Imbalance Detection, Step 2
Bullish IFVG Retest, Step 3
First, the strategy needs to detect a Bullish Order Block in order to start working.
After it's detected, now it's looking for either a CHoCH, or a Volume Imbalance to proceed to the next step, the reason for this is that they both have the same step number.
After one of them is detected, the strategy will consistently check all IFVGs for a retest. If the retest occurs, a long position will be entered.
⏰ ALERTS
This indicator uses TradingView's strategy alert system. All entries and exits will be sent as an alert if configured. It's possible to further customize these alerts to your liking. For more information check TradingView's strategy alert customization page: www.tradingview.com
⚙️ SETTINGS
1. Backtesting Settings
Pyramiding: Controls the number of simultaneous trades allowed in the strategy. This setting must have the same value that is entered on the script's properties tab on the settings pane.
Max Distance to Last Bar: Determines the depth of historical data used to prevent memory overload.
Enable Custom Backtesting Period: Restricts backtesting to a specific date range.
Start & End Time Configuration: Define precise start and end dates for historical analysis.
2. Fair Value Gaps Settings
Zone Invalidation: Select between "Wick" and "Close" invalidation.
Filtering: Choose between "Average Range" and "Volume Threshold".
FVG Sensitivity: Ranges from Extreme to Low to detect FVGs with varying strictness.
Allow Gaps: Enables analysis on tickers that have different open-close price gaps.
3. Inversion Fair Value Gaps Settings
Zone Invalidation: Choose between "Wick" and "Close".
4. Order Block Settings
Swing Length: Adjusts the minimum number of bars required for OB formation.
Zone Invalidation Method: Select between "Wick" and "Close".
5. Breaker Block Settings
Zone Invalidation: Set invalidation method as "Wick" or "Close".
6. Liquidity Grabs Settings
Pivot Length: Adjusts the number of bars used to detect liquidity grabs.
Wick-Body Ratio: Defines the proportion of wick-to-body size for liquidity grab detection.
7. Multi-Timeframe Analysis
Enable Up to Three Timeframes: Select and analyze trades across multiple timeframes.
8. Market Structures
Swing Length: Defines the number of bars required for structure shifts.
Includes BOS, CHoCH, CHoCH+ Detection.
9. Equal Highs & Lows
ATR Multiplier: Defines the sensitivity of equal highs/lows detection.
10. Volume Imbalances
Gap Size Sensitivity: Ranges from "Ultra" to "Low".
Disable Overnight Gaps: Filters out volume imbalances occurring due to overnight gaps.
11. Entry Conditions for Long & Short Trades
Multiple Conditions (1-6): Configure up to six independent conditions per trade direction.
Condition Types: Options include Detection, Retest, Retracement, and Break.
Timeframe Specification: Choose between "Any Timeframe", "Timeframe 1", "Timeframe 2", or "Timeframe 3".
Trade Execution Filters: Restrict trades within specific trading sessions.
12. Exit Conditions for Long & Short Trades
Exit on Opposite Signal: Automatically exit trades upon opposite trade conditions.
Exit on Session End: Closes all positions at the end of the trading session.
Multiple Take-Profit (TP) and Stop-Loss (SL) Configurations:
TP/SL based on % move, ATR, Ticks, or Fixed Price.
Hard SL option for additional risk control.
Move SL to BE (Break Even) after a certain profit threshold.
Z PLUS table take profit & Stop lose ### General Description:
The **Z PLUS Take Profit & Stop Loss** indicator is designed to provide traders with a structured approach to setting take profit (TP) and stop loss (SL) levels. It integrates multiple technical analysis techniques, including moving averages, the Relative Strength Index (RSI), and the Average True Range (ATR), to generate signals for potential trade entries and exits.
Key features of this indicator include:
1. **Trend Detection** – Uses a moving average-based strategy combined with RSI confirmation to determine bullish or bearish trends. The system identifies trend reversals and signals potential long (buy) or short (sell) opportunities.
2. **ATR-Based Stop Loss** – Implements an adaptive stop-loss mechanism that adjusts dynamically based on market volatility. This ensures that stop losses are positioned in a way that minimizes premature exits while still protecting against excessive losses.
3. **Swing High & Swing Low Take Profit Levels** – Incorporates a swing high and swing low detection method to identify key levels for taking profits. These levels help traders optimize their risk-reward ratios.
4. **ADX for Trend Strength Confirmation** – Utilizes the Average Directional Index (ADX) to determine the strength of the trend and adjust stop-loss levels accordingly. The indicator differentiates between strong and weak trends to enhance decision-making.
5. **Visual Signals & Color Coding** – Provides visual cues such as colored stop-loss lines and plotted take-profit markers to enhance usability. The indicator dynamically updates these levels based on price movements.
6. **Flexible Configuration** – Allows users to modify key parameters such as ATR length, sensitivity factors, and profit target percentages to tailor the strategy to their specific trading style and market conditions.
This indicator is best suited for traders looking to improve their risk management strategies while maintaining a structured approach to profit-taking and stop-loss placement.
Altcoins Screener [SwissAlgo]Introduction: The Altcoins Screener at a Glance
The Altcoins Screener is a cryptocurrency analysis tool designed to provide an overview of potential trading opportunities across multiple crypto coins/tokens and categories. By combining technical analysis, price action assessment, and social metrics (via LunarCrush data), it presents market information and trading signals for a broad range of altcoins (approx. 300 USDT.P pairs of 9 crypto categories).
The screener is designed to consolidate market information onto a single chart , aiming to streamline the analysis of market conditions. It provides a consolidated market overview, which can simplify the assessment of market conditions, compared to monitoring individual charts with several layered indicators.
Key Features:
🔹 Multi-category analysis covering 300 crypto pairs of 9 categories on a single chart (Layer 1 & Top Coins, Layer2 & Scaling, Defi & Landing, Gaming & Metaverse, AI & Data, Exchanges & Trading, NFT & Social, Memes & Community, Other, User's Custom Portfolio).
🔹 Technical analysis with trade signals (Long/Short) based on an aggregated view of technical and social data points
🔹 Social sentiment integration through LunarCrush metrics (GalaxyScore, AltRank, Social Sentiment)
🔹 Real-time market scanning provides automated alerts when market conditions for specified coins/tokens potentially change.
🔹 Custom watchlist support for personalized monitoring (users can define a custom category containing a set of specific cryptocurrencies, i.e. own portfolio).
The screener presents data in a table format, using color-coded indicators to aid visual analysis. Detailed technical information is also provided. The assessments/trade signals provided by this indicator should be considered as one input among many when forming your trading strategy.
--------------------------------------
What It Does
The Altcoins Screener is a cryptocurrency analysis tool that offers:
Data Display and Analysis (Technical/Social):
🔹 Technical Metrics
* Technical Raw Data : Displays raw values for a range of technical indicators, including RSI, Stochastic RSI, DMI/ADX, RVI, ATR, OBV, and Hull Moving Averages (including their recent trends and potential significance).
Detailed view of key technical indicators, for further analysis and evaluation:
* Technical Analysis (Summary) : Provides a summarized interpretation of technical conditions based on aggregated parameters:
* Price Action
* Trend
* Momentum
* Volatility
* Volume
Summarized view of confluences for potential long/short bias:
🔹 Social Metrics (LunarCrush) : Presents data from LunarCrush®, including Galaxy Score®, AltRank®, and Social Sentiment® (including their recent trends and potential significance).
Lunarcrush data for the top 10 coins for each crypto category:
🔹 PVSRA (Price Volume & Market Makers Activity) Candles : Shows special candles highlighting potential market maker activity and volume anomalies, helping identify possible manipulation zones (including imbalance zones, i.e. price areas that market makers may revisit)
--------------------------------------
Key Features:
Automated trade signals (Long/Short) are generated based on algorithmic calculations and signal confidence levels across technical and social data points. These signals are intended to be used as one component of a broader trading strategy.
Custom sensitivity settings allow users to adjust the analysis timeframe (options: 1D, 2D, or 1W). Higher timeframes may provide a broader perspective, while the 2D setting is the default configuration.
Multi-category analysis covering a selection of approximately 300 crypto pairs across 9 predefined crypto categories.
Custom symbol selection: Users can define a custom list of up to 10 symbols for focused monitoring.
Automated Alerts to track potential trend changes across crypto categories (Long to Short to Neutral, or vice versa)
Visual Interface:
Organized table display with color-coded indicators to aid interpretation.
Clear and efficient format for scanning market information.
--------------------------------------
Target Audience
🔹 The screener is designed for cryptocurrency traders who:
Need to efficiently monitor multiple USDT perpetual futures markets
Use technical analysis in their trading decisions
Want to track sector-wide movements across crypto categories
🔹 Suitable for different trading styles:
Scalpers requiring quick market assessment
Swing traders analyzing multi-day trends
Position traders monitoring longer-term setups
The color-coded interface makes it accessible for intermediate traders while providing detailed metrics for advanced users. A basic understanding of technical analysis and crypto trading is recommended.
--------------------------------------
How It Works
The Altcoins Screener evaluates cryptocurrencies through a multi-layered analysis:
🔹 Core Analysis Components
Each parameter combines multiple indicators for comprehensive evaluation:
Price Action
EMA crossovers and momentum
Support/resistance zones
Candlestick patterns
Trend
Hull Moving Average system
DMI/ADX trend strength
Multi-timeframe confirmation
Momentum
RSI/Stochastic RSI readings
MACD convergence/divergence
Oscillator confirmations
Volatility
RVI/ATR measurements
Bollinger Bands behavior
Historical volatility trends
Volume
OBV trend analysis
Volume/price correlations
Volume profile assessment
🔹 Signal Generation Process
1. Real-time data collection across timeframes
2. Weighted indicator calculations
3. Parameter aggregation and analysis
4. Signal strength determination
5. Color-coding and alert generation
--------------------------------------
How to Use
🔹 Initial Setup:
Add the indicator to a chart (use the 1D timeframe)
Select your preferred crypto category or create a custom list
Choose between Technical Analysis or Technical Metrics view
Set data sensitivity based on your trading style
🔹 Using the Technical Analysis View:
Monitor color-coded dots for quick market assessment
Green: bullish conditions
Red: bearish conditions
Gray: neutral conditions
Check the "Trade Signal" column for potential Long/Short entries signaled by confluences among technical and/or social data points
🔹 Using the Technical Metrics View:
Review detailed numerical values
Monitor slopes (↑↓ arrows) for the most recent trend direction of each data point
Watch for pivotal points (highlighted cells): these are data points that suggest potential trend reversals
Focus on the confluence of multiple indicators
The technical metrics view corroborates the conclusions shown in the Technical Analysis View, providing more details about some critical data points.
🔹 Alert Configuration:
Enable Technical Alerts for signal notifications (which coin/token seems most suited for Long or Short trades, and which coin/token is in a neutral/uncertain state for trading = "No Trade")
Configure alert conditions based on trading style
Set timeframe-appropriate sensitivity
Monitor alert messages for trade signals
Instructions on how to set alerts are provided in the script (enable "Signals Setup Instructions" in User Interface to get a step-by-step guide about setting up alerts)
Best Practices:
Confirm signals across multiple timeframes
Use appropriate sensitivity for your trading style
Monitor multiple categories for sector rotation
Combine signals with your trading strategy
Verify signals with price action confirmation and deep dive into the charts of your potential targets
--------------------------------------
About the Settings
🔹 Crypto Category Selection
Layer 1 & Major: Top market cap coins (BTC, ETH, XRP,...), established protocols
Layer 2 & Scaling: ETH L2s, scaling solutions
DeFi & Lending: Decentralized finance protocols
Gaming & Metaverse: Gaming and virtual world tokens
AI & Data: Artificial intelligence and data projects
Exchange & Trading: Exchange tokens, trading protocols
NFT & Social: NFT platforms, social tokens
Memes & Community: Community-driven tokens
Others & Misc: Other categories
Custom Category: User-defined list (up to 10 symbols)
Data Type Options
Technical Analysis: Color-coded summary view
Technical Metrics: Detailed numerical values of some key technical data points
Sensitivity Settings
Higher: Shorter timeframe, more frequent signals
Default: Balanced timeframe, standard signals
Lower: Longer timeframe, stronger signals
Alert Settings
Technical Alerts: Trade signal notifications
Data Timeframe: Minimum 1D required
Theme: Dark/Light mode options
Note: All analysis is performed on USDT Perpetual Futures pairs from Binance
--------------------------------------
FAQ
Q: Does the screener work on other exchanges besides Binance?
A: No, it's designed specifically for Binance USDT Perpetual Futures pairs. Binance offers the highest liquidity and trading volume in the crypto derivatives market, making it ideal for technical analysis. The extensive range of trading pairs and reliable data streams help ensure more accurate signals and analysis. Using a single high-liquidity exchange also helps avoid inconsistencies that could arise from aggregating data across multiple platforms with varying liquidity levels.
Q: What's the minimum timeframe required?
A: The screener requires a minimum 1D (daily) timeframe. This requirement ensures that the technical analysis has sufficient data points for reliable signal generation. Lower timeframes can produce more noise and false signals, while daily timeframes help filter out market noise and identify stronger trends.
Q: Why are some social metrics showing "NaN"?
A: "NaN" (Not a Number) appears when cryptocurrencies don't have associated LunarCrush data. This typically occurs with newer tokens or those with lower market caps. The technical analysis remains fully functional regardless of social metric availability, as these are complementary data points.
Q: How often are signals updated?
A: Signals update with each new candle on the selected timeframe (1D, 2D, or 1W). For example, on the default 2D setting, signals are recalculated every two days as new candles form. This helps reduce noise while maintaining timely analysis of market conditions.
Q: Can I add spot trading pairs?
A: No, the screener is optimized for Binance USDT perpetual futures pairs for data consistency and analysis purposes. While spot and perpetual prices typically align closely due to arbitrage, using a single data source (Binance) and contract type (USDT perpetual) ensures uniform data quality and analysis across all pairs. This standardization helps maintain reliable technical analysis and signal generation.
Q: How many coins can I add to my custom list?
A: Users can add up to 10 custom symbols to their watchlist. This limit is designed to maintain optimal performance while allowing focused monitoring of specific assets. The custom list complements the predefined categories that cover over 300 pairs.
Q: What determines signal confidence levels?
A: Signal confidence is calculated through a weighted algorithm that considers multiple factors: trend strength (Hull MA, DMI/ADX), momentum indicators (RSI, SRSI), volatility measurements (RVI, ATR, BB), volume analysis (OBV, volume trends), and price action patterns. Higher confidence levels indicate stronger alignment across these factors.
Q: Are signals guaranteed to work?
A: No. Signals are analytical tools based on historical and current market data, not guaranteed predictions. They should be used as one component of a comprehensive trading strategy that includes proper risk management, position sizing, and additional confirmation factors. Past performance does not guarantee future results.
Q: Why does the screener need higher timeframes?
A: Higher timeframes (1D minimum) provide several benefits: reduced market noise, more reliable technical signals, better trend identification, and lower likelihood of false signals. They also align better with institutional trading patterns and allow for a more thorough analysis of market conditions across multiple indicators.
--------------------------------------
Conclusion
The Altcoins Screener is a comprehensive crypto market analysis tool that:
Scans 300+ cryptocurrencies across 9 sectors on a single chart
Combines technical indicators and social metrics for signal generation
Identifies potential trading opportunities through color-coded visuals
Saves time by eliminating the need to monitor multiple charts
The tool is suited for:
Market overview and sector rotation analysis
Quick assessment of market conditions
Technical and social sentiment tracking
Systematic trading approach with alerts
Use this screener with caution and as a complement to any other tool you use to define your trading strategy.
--------------------------------------
Disclaimer
This indicator is for informational and educational purposes only:
Not financial advice: This indicator should not be considered investment advice.
No guarantee of accuracy: The indicator's calculations and signals are based on specific algorithms and data sources, but accuracy cannot be guaranteed. Market conditions can change rapidly.
Past performance is not predictive: Past performance of the indicator's signals or any specific asset is not indicative of future results.
Substantial risk of loss: Trading cryptocurrencies involves a substantial risk of loss. You can lose money trading these assets.
User responsibility: Users are solely responsible for their own trading decisions and should exercise caution.
Independent research required: Always conduct thorough independent research (DYOR) before making any trading decisions.
Technical analysis is one of many tools: Technical analysis, including the output of this indicator, is just one tool among many and should not be relied upon exclusively.
Risk management is essential: Use proper risk management techniques, including position sizing and stop-loss orders.
Comprehensive strategy: Use this tool as part of a comprehensive trading strategy, not as a standalone solution.
No liability for trading results: The Author assumes no responsibility or liability for any trading results or losses incurred as a result of using this indicator.
No TradingView affiliation: SwissAlgo is an independent entity and is not affiliated with or endorsed by TradingView.
LunarCrush data: The indicator utilizes publicly available data from LunarCrush. LunarCrush data and trademarks are the property of LunarCrush.
Consult a financial advisor: Consult with a qualified financial advisor before making any investment decisions.
By using this indicator, you acknowledge and agree to these terms. If you do not agree with these terms, please refrain from using this indicator.
Strategy Development Environment [BerlinCode42]Happy Trade,
Intro
What is New
Algebraic/Boolean Equation
Instruction Set for The Algebraic/Boolean Equation
Example
Usage
Settings Menu
Declaration for Tradingview House Rules on Script Publishing
Disclaimer
Conclusion
1. Intro
This is a rich equipped fork of my previous "Backtest any Indicator v5". And serves as the fitting backtester and trade strategy creation tool for my upcoming ANN Indicators (artificial neural network).
As the previous version this script has no trade signal generating code. The trade signals comes in by the five user settable input slots where the user plug-in external indicators. The final trade siganls go long etc are defined by a algebraic/boolean equation typed in as text in 4 terminals as shown in Image 0 . With this algebraic/boolean equations input the user can setup any trade logic as complex and fast and easy as never seen before here on TradingView.
Image 0
2. What is new
Input algebraic/boolean equations in text-form for go long, go short, exit long & exit short
Five input slots for external indicator signals
Equation tester
User settable signal delay for enter and exit trades
User selectable alternating trades filter
User settable exit long = enter short
Intrabar or trade only on bar closing
Time filter with duration input
User settable UTC Adjustment
Long and short trades possible
Two Take Profits with quantity setting
Trailing Stop
Webhook connection
3. Algebraic/Boolean Equation
This is where the magic happens. Unlike other backtesters that rely on drop-down menus to define trade signal equations—thus limiting the number of input signals and the complexity of logic—this script uses a string interpreter to solve equations. With this, you can develop your trade logic equations and add signals or conditions simply by writing them down in algebraic/boolean form.
The instruction set for this interpreter includes not only external input signals but also several internal values. These include BarTime, BarIndex, Open, High, Low, Close, True Range, Minimal Tick, Volume, and a signal that indicates whether there is an open trade (long, short, or none). You can also reference the values of past bars for all these inputs and, of course, use constant values in your equations. There is a sad limitation: Only one past bar value per equation is practicable. If you use more, errors can occur. It seems to be caused by the pipe line architecture of the parallel computing. In any attempt to solve this issue an older function call result was hand over.
The implemented functions cover a wide range of algebraic and boolean operations. A boolean "true" is represented by all values greater than zero, while "false" is represented by zero or values less than zero.
4. Instruction set for the Algebraic/Boolean Equation
There are functions that accept either two input values or one input value. The general form is (XandY) or (notX), where X and Y can be any input slot, predefined value, constant, or another sub-equation. Functions are always written in lowercase, while input slots and predefined values use uppercase letters.
Each sub-equation must be enclosed in parentheses, e.g., (A+B). Without proper use of parentheses, the interpreter cannot determine which function to calculate first. Negative constants must be expressed by subtracting from zero (e.g., (0-3.14)), so careful attention is required.
Here are some examples that demonstrate both incorrect and correct notations:
incorrect correct
(A+B*C) (A+(B*C))
(A+B+D+E) (A+(B+(D+E)))
(-20>A) ((0-20)>A)
(A*-B) (A*(0-B))
(AnotB) (Aand(notB))
ABS(a-b) (abs(A-B))
The correct usage ensures the interpreter calculates in the intended order.
And here comes the complete Instruction Set:
Addition: (A+B)
Subtraction: (A-B)
Multiplication: (A*B)
Division: (A/B)
Absolut value: (absA)
Power of: (A^B)
Natural Logarithm: (logA)
Lowest value of Low of last x bars: (lotx)
Highest value of High of last x bars: (hotx)
Modulo, Remainder of a Division: (A%B)
Round: (rndA)
round to ceil: (ceiA)
Round to floor: (floA)
Round to next minimal tick: (mitA)
EMA of A of last 3 bars: (e03A)
EMA of A of last 7 bars: (e07A)
EMA of A of last 10 bars: (e10A)
EMA of A of last 20 bars: (e20A)
EMA of A of last 50 bars: (e50A)
Smaller then: (AB)
Equal to: (A==B)
Unequal to: (A!=B)
And: (AandB)
Or: (AorB)
Exclusive Or: (AxorB)
Not: (notA)
Past bar value: (A ) ,whereby x can be 1,2,3,...,barIndex-1
Bar time: (T)
Bar index: (I)
Opening Price of Bar: (O)
Highest Price of Bar: (H)
Lowest Price of Bar: (L)
Closing Price of Bar: (C)
Min tick value for the current symbol: (K)
Trade Volume: (V)
True Range: (R)
Is Money invested: (M) ,Long position: M=1,
Short position: M=-1,
No position: M=0
Reminder: if you wanna replace A or B above don't forget the parentheses. So if you have (logA) and wanna replace A with D+F so the correct replacement would be (log(D+F)).
In the following there are some examples of popular bar patterns and useful filters:
Doji: ((abs(O-C))<(10*K))and((H-L)>(100*K))
green Hammer: (((H-C)<(5000*K))and(((O-L)/2)>(abs(O-C)))
Up trend: (C>(e10H))
Down trend: (C<(e10L))
cool down 7 bars: (( any buy condition )and((e07(absM))==0))
possible Pivot High: (H==(hot30))and((CC))
possible Pivot Low: (L==(lot30))and((C>H )or(O0)), goShort ((A>0)and((A )<0)), Enter Signal delay=0, Exit Signal delay=0, Alternate Trades=true
take profit 1 =0.4% (30%), take profit 2 =0.7%, trailing stop loss=0.2%, intrabar, start capital=1000$, qty=5%, fee=0.05%, no Session Filter
Image 1
6. Usage
First you need to attach some signals from external Indicators. In the example above we use the Stochastic RSI indicator from TradingView. Load the Stochastic RSI indicator to the chart. Then you go to the settings menu of this script, choose in the drop-down menu of Input A the signal .
In case you wanna use a signal which is not in the drop-down menu of Input A do the following:
1) You need to know the name of the boolean (or integer) variable of your indicator which hold the desired signal. Lets say that this boolean variable is called BUY. If this BUY variable is not plotted on the chart you simply add the following code line at the end of your pine script.
For boolean (true/false) BUY variables use this:
plot(BUY ? 1:0,'Your buy condition hold in that variable BUY',display = display.data_window)
And in case your script's BUY variable is an integer or float then use instate the following code line:
plot(BUY ,'Your buy condition hold in that variable BUY',display = display.data_window)
2) Probably the name of this BUY variable in your indicator is not BUY. Simply replace in the code line above the BUY with the name of your script's trade condition variable.
3) Do the same procedure for your SELL variable. Then save your changed Indicator script.
4) Then add the changed Indicator script from step before and this backtester script to the chart ...
5) and go to the settings of it. Choose under "Settings -> Input A " your Indicator. So in the example above choose .
The form is usually: ' : BUY'. Then you see something like Image 1
6) Decide about each trade logic for Go Long and Go Short . In this Example we use for GoLong if "Stoch RSI: K" is smaller then 20. The "Stoch RSI: K" we already loaded it in input A. So we set under Go Long (A<20) and set Enter Signal Delay to 0.
Now we setup Go Short if "Stoch RSI: K" is bigger then 80. So we set under Go Short A>80. Enter Signal Delay is already set.
7) For the Exit conditions you can choose (trailing) Stop loss or Take Profit or Exit by Indicator Signal. What ever comes first triggers the exit. If you like to use an EMA Indicator for the Exit by Indicator just load it in a free input slot B, D, E, F or use the inbuild EMA. For this example we use the inbuild EMA of the last 7 values of close. It is called by the following equation: (e07C). So to exit a long trade when the close price crossunder this EMA you have to type in Exit Long ((e07C)>C). For exit a short trade enter in Exit Short ((e07C)
Milvetti_Pineconnector_LibraryLibrary "Milvetti_Pineconnector_Library"
This library has methods that provide practical signal transmission for Pineconnector.Developed By Milvetti
buy(licenseId, symbol, risk, sl, tp, beTrigger, beOffset, trailTrig, trailDist, trailStep, atrTimeframe, atrTrigger, atrPeriod, atrMultiplier, atrShift, spread, accFilter, secret, comment)
Create a buy order message
Parameters:
licenseId (string) : License Id. This is a unique identifier found in the Pineconnector Licensing Dashboard.
symbol (string) : Symbol. Default is syminfo.ticker
risk (float) : Risk. Function depends on the “Volume Type” selected in the EA
sl (float) : StopLoss. Place stop-loss. Computation is based on the Target Type selected in the EA. Default is 0(inactive)
tp (float) : TakeProfit. Place take-profit. Computation is based on the Target Type selected in the EA. Default is 0(inactive)
beTrigger (float) : Breakeven will be activated after the position gains this number of pips. Ensure > 0
beOffset (float) : Offset from entry price. 0 means the SL will be placed exactly at entry price. 1 means 1 pip above the entry price for buy trades and 1 pip below for sell trades.
trailTrig (int) : Trailing stop-loss will be activated after a trade gains this number of pips. Default is 0(inactive)
trailDist (int) : SL will be opened at traildist after trailtrig is met, even if you do not have a SL placed.. Default is 0(inactive)
trailStep (int) : Moves trailing stop-loss once price moves to favourable by a specified number of pips. Default is 0(inactive)
atrTimeframe (string) : ATR Trailing Stop will be based on the specified timeframe in minutes and will only update once per bar close. Default is Timeframe.Period
atrTrigger (float) : Activate the trigger of ATR Trailing after market moves favourably by a number of pips. Default is 0(inactive)
atrPeriod (int) : ATR averaging period. Default is 0
atrMultiplier (float) : Multiple of ATR to utilise in the new SL computation. Default is 1
atrShift (float) : Relative shift of price information, 0 uses latest candle, 1 uses second last, etc. Default is 0
spread (float) : Enter the position only if the spread is equal or less than the specified value in pips. Default is 0(inactive)
accFilter (float) : Enter the position only if the account requirement is met. Default is 0(inactive)
secret (string)
comment (string) : Comment. Add a string into the order’s comment section. Default is "Symbol+Timeframe"
sell(licenseId, symbol, risk, sl, tp, beTrigger, beOffset, trailTrig, trailDist, trailStep, atrTimeframe, atrTrigger, atrPeriod, atrMultiplier, atrShift, spread, accFilter, secret, comment)
Create a buy order message
Parameters:
licenseId (string) : License Id. This is a unique identifier found in the Pineconnector Licensing Dashboard.
symbol (string) : Symbol. Default is syminfo.ticker
risk (float) : Risk. Function depends on the “Volume Type” selected in the EA
sl (float) : StopLoss. Place stop-loss. Computation is based on the Target Type selected in the EA. Default is 0(inactive)
tp (float) : TakeProfit. Place take-profit. Computation is based on the Target Type selected in the EA. Default is 0(inactive)
beTrigger (float) : Breakeven will be activated after the position gains this number of pips. Ensure > 0
beOffset (float) : Offset from entry price. 0 means the SL will be placed exactly at entry price. 1 means 1 pip above the entry price for buy trades and 1 pip below for sell trades.
trailTrig (int) : Trailing stop-loss will be activated after a trade gains this number of pips. Default is 0(inactive)
trailDist (int) : SL will be opened at traildist after trailtrig is met, even if you do not have a SL placed.. Default is 0(inactive)
trailStep (int) : Moves trailing stop-loss once price moves to favourable by a specified number of pips. Default is 0(inactive)
atrTimeframe (string) : ATR Trailing Stop will be based on the specified timeframe in minutes and will only update once per bar close. Default is Timeframe.Period
atrTrigger (float) : Activate the trigger of ATR Trailing after market moves favourably by a number of pips. Default is 0(inactive)
atrPeriod (int) : ATR averaging period. Default is 0
atrMultiplier (float) : Multiple of ATR to utilise in the new SL computation. Default is 1
atrShift (float) : Relative shift of price information, 0 uses latest candle, 1 uses second last, etc. Default is 0
spread (float) : Enter the position only if the spread is equal or less than the specified value in pips. Default is 0(inactive)
accFilter (float) : Enter the position only if the account requirement is met. Default is 0(inactive)
secret (string)
comment (string) : Comment. Add a string into the order’s comment section. Default is "Symbol+Timeframe"
buyLimit(licenseId, symbol, pending, risk, sl, tp, beTrigger, beOffset, trailTrig, trailDist, trailStep, atrTimeframe, atrTrigger, atrPeriod, atrMultiplier, atrShift, spread, accFilter, secret, comment)
Create a buy limit order message
Parameters:
licenseId (string) : License Id. This is a unique identifier found in the Pineconnector Licensing Dashboard.
symbol (string) : Symbol. Default is syminfo.ticker
pending (float) : Computing pending order entry price. EA Options: Pips, Specified Price, Percentage
risk (float) : Risk. Function depends on the “Volume Type” selected in the EA
sl (float) : StopLoss. Place stop-loss. Computation is based on the Target Type selected in the EA. Default is 0(inactive)
tp (float) : TakeProfit. Place take-profit. Computation is based on the Target Type selected in the EA. Default is 0(inactive)
beTrigger (float) : Breakeven will be activated after the position gains this number of pips. Ensure > 0
beOffset (float) : Offset from entry price. 0 means the SL will be placed exactly at entry price. 1 means 1 pip above the entry price for buy trades and 1 pip below for sell trades.
trailTrig (int) : Trailing stop-loss will be activated after a trade gains this number of pips. Default is 0(inactive)
trailDist (int) : SL will be opened at traildist after trailtrig is met, even if you do not have a SL placed.. Default is 0(inactive)
trailStep (int) : Moves trailing stop-loss once price moves to favourable by a specified number of pips. Default is 0(inactive)
atrTimeframe (string) : ATR Trailing Stop will be based on the specified timeframe in minutes and will only update once per bar close. Default is Timeframe.Period
atrTrigger (float) : Activate the trigger of ATR Trailing after market moves favourably by a number of pips. Default is 0(inactive)
atrPeriod (int) : ATR averaging period. Default is 0
atrMultiplier (float) : Multiple of ATR to utilise in the new SL computation. Default is 1
atrShift (float) : Relative shift of price information, 0 uses latest candle, 1 uses second last, etc. Default is 0
spread (float) : Enter the position only if the spread is equal or less than the specified value in pips. Default is 0(inactive)
accFilter (float) : Enter the position only if the account requirement is met. Default is 0(inactive)
secret (string)
comment (string) : Comment. Add a string into the order’s comment section. Default is "Symbol+Timeframe"
buyStop(licenseId, symbol, pending, risk, sl, tp, beTrigger, beOffset, trailTrig, trailDist, trailStep, atrTimeframe, atrTrigger, atrPeriod, atrMultiplier, atrShift, spread, accFilter, secret, comment)
Create a buy stop order message
Parameters:
licenseId (string) : License Id. This is a unique identifier found in the Pineconnector Licensing Dashboard.
symbol (string) : Symbol. Default is syminfo.ticker
pending (float) : Computing pending order entry price. EA Options: Pips, Specified Price, Percentage
risk (float) : Risk. Function depends on the “Volume Type” selected in the EA
sl (float) : StopLoss. Place stop-loss. Computation is based on the Target Type selected in the EA. Default is 0(inactive)
tp (float) : TakeProfit. Place take-profit. Computation is based on the Target Type selected in the EA. Default is 0(inactive)
beTrigger (float) : Breakeven will be activated after the position gains this number of pips. Ensure > 0
beOffset (float) : Offset from entry price. 0 means the SL will be placed exactly at entry price. 1 means 1 pip above the entry price for buy trades and 1 pip below for sell trades.
trailTrig (int) : Trailing stop-loss will be activated after a trade gains this number of pips. Default is 0(inactive)
trailDist (int) : SL will be opened at traildist after trailtrig is met, even if you do not have a SL placed.. Default is 0(inactive)
trailStep (int) : Moves trailing stop-loss once price moves to favourable by a specified number of pips. Default is 0(inactive)
atrTimeframe (string) : ATR Trailing Stop will be based on the specified timeframe in minutes and will only update once per bar close. Default is Timeframe.Period
atrTrigger (float) : Activate the trigger of ATR Trailing after market moves favourably by a number of pips. Default is 0(inactive)
atrPeriod (int) : ATR averaging period. Default is 0
atrMultiplier (float) : Multiple of ATR to utilise in the new SL computation. Default is 1
atrShift (float) : Relative shift of price information, 0 uses latest candle, 1 uses second last, etc. Default is 0
spread (float) : Enter the position only if the spread is equal or less than the specified value in pips. Default is 0(inactive)
accFilter (float) : Enter the position only if the account requirement is met. Default is 0(inactive)
secret (string)
comment (string) : Comment. Add a string into the order’s comment section. Default is "Symbol+Timeframe"
sellLimit(licenseId, symbol, pending, risk, sl, tp, beTrigger, beOffset, trailTrig, trailDist, trailStep, atrTimeframe, atrTrigger, atrPeriod, atrMultiplier, atrShift, spread, accFilter, secret, comment)
Create a sell limit order message
Parameters:
licenseId (string) : License Id. This is a unique identifier found in the Pineconnector Licensing Dashboard.
symbol (string) : Symbol. Default is syminfo.ticker
pending (float) : Computing pending order entry price. EA Options: Pips, Specified Price, Percentage
risk (float) : Risk. Function depends on the “Volume Type” selected in the EA
sl (float) : StopLoss. Place stop-loss. Computation is based on the Target Type selected in the EA. Default is 0(inactive)
tp (float) : TakeProfit. Place take-profit. Computation is based on the Target Type selected in the EA. Default is 0(inactive)
beTrigger (float) : Breakeven will be activated after the position gains this number of pips. Ensure > 0
beOffset (float) : Offset from entry price. 0 means the SL will be placed exactly at entry price. 1 means 1 pip above the entry price for buy trades and 1 pip below for sell trades.
trailTrig (int) : Trailing stop-loss will be activated after a trade gains this number of pips. Default is 0(inactive)
trailDist (int) : SL will be opened at traildist after trailtrig is met, even if you do not have a SL placed.. Default is 0(inactive)
trailStep (int) : Moves trailing stop-loss once price moves to favourable by a specified number of pips. Default is 0(inactive)
atrTimeframe (string) : ATR Trailing Stop will be based on the specified timeframe in minutes and will only update once per bar close. Default is Timeframe.Period
atrTrigger (float) : Activate the trigger of ATR Trailing after market moves favourably by a number of pips. Default is 0(inactive)
atrPeriod (int) : ATR averaging period. Default is 0
atrMultiplier (float) : Multiple of ATR to utilise in the new SL computation. Default is 1
atrShift (float) : Relative shift of price information, 0 uses latest candle, 1 uses second last, etc. Default is 0
spread (float) : Enter the position only if the spread is equal or less than the specified value in pips. Default is 0(inactive)
accFilter (float) : Enter the position only if the account requirement is met. Default is 0(inactive)
secret (string)
comment (string) : Comment. Add a string into the order’s comment section. Default is "Symbol+Timeframe"
sellStop(licenseId, symbol, pending, risk, sl, tp, beTrigger, beOffset, trailTrig, trailDist, trailStep, atrTimeframe, atrTrigger, atrPeriod, atrMultiplier, atrShift, spread, accFilter, secret, comment)
Create a sell stop order message
Parameters:
licenseId (string) : License Id. This is a unique identifier found in the Pineconnector Licensing Dashboard.
symbol (string) : Symbol. Default is syminfo.ticker
pending (float) : Computing pending order entry price. EA Options: Pips, Specified Price, Percentage
risk (float) : Risk. Function depends on the “Volume Type” selected in the EA
sl (float) : StopLoss. Place stop-loss. Computation is based on the Target Type selected in the EA. Default is 0(inactive)
tp (float) : TakeProfit. Place take-profit. Computation is based on the Target Type selected in the EA. Default is 0(inactive)
beTrigger (float) : Breakeven will be activated after the position gains this number of pips. Ensure > 0
beOffset (float) : Offset from entry price. 0 means the SL will be placed exactly at entry price. 1 means 1 pip above the entry price for buy trades and 1 pip below for sell trades.
trailTrig (int) : Trailing stop-loss will be activated after a trade gains this number of pips. Default is 0(inactive)
trailDist (int) : SL will be opened at traildist after trailtrig is met, even if you do not have a SL placed.. Default is 0(inactive)
trailStep (int) : Moves trailing stop-loss once price moves to favourable by a specified number of pips. Default is 0(inactive)
atrTimeframe (string) : ATR Trailing Stop will be based on the specified timeframe in minutes and will only update once per bar close. Default is Timeframe.Period
atrTrigger (float) : Activate the trigger of ATR Trailing after market moves favourably by a number of pips. Default is 0(inactive)
atrPeriod (int) : ATR averaging period. Default is 0
atrMultiplier (float) : Multiple of ATR to utilise in the new SL computation. Default is 1
atrShift (float) : Relative shift of price information, 0 uses latest candle, 1 uses second last, etc. Default is 0
spread (float) : Enter the position only if the spread is equal or less than the specified value in pips. Default is 0(inactive)
accFilter (float) : Enter the position only if the account requirement is met. Default is 0(inactive)
secret (string)
comment (string) : Comment. Add a string into the order’s comment section. Default is "Symbol+Timeframe"
Pattern Pro VPOCSummary:
This indicator combines multi-timeframe pattern detection (triangles and wedges), Volume Point of Control (VPOC) visualization, predictive volume modeling, and a swing-based VWAP. It provides traders with a detailed view of key trading patterns, high-volume levels, and entry/exit opportunities, all integrated into one powerful tool.
How This Script is Unique:
Multi-Timeframe Pattern Analysis:
Identifies chart patterns like triangles and wedges across multiple timeframes, enhancing the trader's ability to spot actionable opportunities.
Dynamically tracks pivot points and projected trendlines to visualize ongoing and potential patterns.
Volume Point of Control (VPOC):
Automatically calculates and plots the VPOC for detected patterns, highlighting the price level with the highest traded volume.
Helps identify strong support/resistance levels within patterns.
Predictive Volume Modeling:
Predicts high-volume trading times based on historical averages, allowing traders to anticipate periods of increased market activity.
Bars are color-coded to reflect projected volume activity.
Swing-Based VWAP:
Incorporates swing highs and lows into VWAP calculations, making it adaptive to current market conditions.
Offers a more dynamic view compared to traditional static VWAP indicators.
Trade Management Features:
Visualizes stop-loss (SL) and take-profit (TP) levels directly on the chart.
Tracks active trades and peak performance, enabling effective trade management.
Customizability:
Offers user-defined settings for timeframe selection, risk management, and volume modeling, making it adaptable to various trading strategies.
How to Use:
Pattern Detection:
The script automatically identifies triangle and wedge patterns. No manual input is needed for detection.
Patterns are displayed with top and bottom trendlines and the associated VPOC.
Volume Modeling:
Enable "Use Predictive Volume" under the Predictive Volume settings to highlight periods of projected high activity.
Customize the moving average period and date range for better precision.
Swing-Based VWAP:
Enable "Use VWAP" and configure the anchor period to suit your trading timeframe (e.g., Session, Week, Month).
The VWAP adapts dynamically to swings for precise insights.
Risk Management:
Adjust initial risk, multiplier, and drawdown limits under Risk Management settings.
Visual SL and TP boxes make it easy to monitor trade progress.
Alerts:
Enable "Pattern Alert" to receive notifications for detected patterns.
Use "Trade Alert" to get notified of potential entry opportunities.
Custom Inputs:
Customize "Lookback Bars for VPOC" to define how far back the indicator searches for volume data.
Modify "Row Size" and "POC Settings" for precise VPOC plotting.
Related Links:
Swing-Based VWAP
Intraday Predictive High-Volume Activity Sessions
Trade Settings:
Pattern Timeframe Input:
Select the timeframe used for detecting patterns (e.g., Chart, 15m, 1H).
Use: Helps identify patterns specific to the selected timeframe.
Bars to Entry:
Defines the number of bars within which a trade should be entered after a pattern is detected.
Use: Ensures timely entries based on identified patterns.
Plot Peak Profit:
Toggles the visualization of the peak profit level for trades.
Use: Helps monitor the maximum potential profit from a trade.
Use Close of Candle Above/Below Top/Bottom Line:
When enabled, the script uses the close of the candle instead of wicks to determine line breakouts.
Use: Ensures more precise break detection for pattern confirmation.
Pattern VPOC Settings:
Lookback Bars for VPOC:
Specifies the number of bars to analyze for calculating the Volume Point of Control (VPOC).
Use: Adjusts the depth of data analyzed for VPOC determination.
Row Size:
Determines the granularity of VPOC calculations. Higher values result in finer divisions.
Use: Fine-tune VPOC plotting for greater precision.
Pattern VPOC Color:
Sets the color of the VPOC line on the chart.
Use: Customize chart aesthetics for better visibility.
Width:
Adjusts the thickness of the VPOC line.
Use: Makes the line more prominent on the chart.
Risk Management:
Initial Risk:
Specifies the base risk amount for each trade.
Use: Helps determine the trade size based on risk tolerance.
Risk Increment Type:
Selects whether risk increments are linear or exponential after consecutive losses.
Use: Adjusts risk dynamically to manage losses effectively.
Multiplier:
Multiplies the risk in exponential mode to calculate the next risk value after a loss.
Use: Defines the growth factor for exponential risk.
Max Drawdown:
Sets the maximum drawdown value before halting trading.
Use: Protects against significant capital depletion.
Initial Capital:
Specifies the starting capital for performance calculations.
Use: Helps measure performance and calculate drawdown percentages.
Alert Settings:
Trade Alert:
Enables alerts for detected trade setups.
Use: Keeps the user notified about potential trade opportunities.
Pattern Alert:
Enables alerts for detected patterns.
Use: Provides immediate notification when a pattern is identified.
Predictive Volume:
Use Predictive Volume:
Toggles the predictive volume modeling feature.
Use: Highlights projected high-volume periods for better timing.
Select Timeframe for Predictive Volume:
Defines the timeframe for predictive volume analysis.
Use: Allows predictive modeling to align with the user's trading style.
MA Average Periods:
Sets the moving average length for volume prediction.
Use: Smoother or more responsive predictive models based on user preference.
Date Range:
Specifies the historical range used for volume analysis.
Use: Limits the scope of volume data for calculations.
VWAP Settings:
Use VWAP:
Toggles the VWAP calculation and plotting.
Use: Tracks the average price weighted by volume to find key price levels.
Hide VWAP on 1D or Above:
Hides VWAP plots on daily or higher timeframes.
Use: Avoids clutter on charts with higher timeframes.
Anchor Period:
Sets the anchor period for VWAP calculation (e.g., Session, Week, Month).
Use: Aligns VWAP with the selected timeframe.
Source:
Defines the price source for VWAP calculation (default: hlc3).
Use: Adjusts VWAP based on the preferred price type.
Offset:
Adjusts the VWAP line's placement by the specified number of bars.
Use: Moves the VWAP line forward or backward for better visual alignment.
Swing Size:
Defines the sensitivity for detecting swing highs and lows in VWAP calculations.
Use: Refines VWAP calculations to match market swings.
TradingIQ - Counter Strike IQIntroducing "Counter Strike IQ" by TradingIQ
Counter Strike IQ is an exclusive trading algorithm developed by TradingIQ, designed to trade upside/downside breakouts of varying significance. By integrating artificial intelligence and IQ Technology, Counter Strike IQ analyzes historical and real-time price data to construct a dynamic trading system adaptable to various asset and timeframe combinations.
Philosophy of Counter Strike IQ
Counter Strike IQ operates on a single premise: Support and resistance levels cannot hold forever. At some point either side must break for the underlying asset to exhibit trends; otherwise, prices would be confined to an infinitely narrowing range.
Counter Strike IQ is designed to work straight out of the box. In fact, its simplicity requires just four user settings to manage output, making it incredibly straightforward to manage.
Minimum ATR Profit, Minimum ATR Stop, EMA Filter and EMA Filter Length are the only settings that manage the performance of Counter Strike IQ!
Traders don’t have to spend hours adjusting settings and trying to find what works best - Counter Strike IQ handles this on its own.
Key Features of Counter Strike IQ
Self-Learning Breakout Detection
Employs AI and IQ Technology to identify notable breakouts in real-time.
AI-Generated Trading Signals
Provides breakout trading signals derived from self-learning algorithms.
Comprehensive Trading System
Offers clear entry and exit labels.
Performance Tracking
Records and presents trading performance data, easily accessible for user analysis.
Self-Learning Trading Exits
Counter Strike IQ learns where to exit positions.
Long and Short Trading Capabilities
Supports both long and short positions to trade various market conditions.
Strike Channel
The Strike Channel represents what Counter Strike IQ considers a tradable long opportunity or a tradable short opportunity. The Strike Channel is dynamic and adjusts from chart to chart.
IQ Graph Gradient
Introduces the IQ Graph Gradient, designed to classify extreme values in price on a grand scale.
How It Works
Counter Strike IQ operates on a straightforward heuristic: go long during significant upside price moves that break established resistance levels and go short during significant downside price moves that break established support levels.
IQ Technology, TradingIQ's proprietary AI algorithm, defines what constitutes a “significant price move” and what’s considered a tradable breakout. For Counter Strike IQ, this algorithm evaluates all historical support/resistance breaks and any subsequent breakouts. For instance, the price move following up to a breakout is measured and learned from, including the significance of the identified support/resistance level (how long it’s been active, how far price moved away from it, etc). By analyzing these patterns, Counter Strike IQ adapts to identify and trade similar future breakout sequences.
In simple terms, Counter Strike IQ learns from violations of historical support/resistance levels to identify potential entry points at currently established support/resistance levels. Using this knowledge, it determines the optimal, current support/resistance price level where a breakout has a higher chance of occurring.
For long positions, Counter Strike IQ places a stop-market order at the AI-identified resistance point. If price violates this level a market order will be placed and a long position entered. Of course, this is how the algorithm trades, users can elect to use a stop-limit order amongst other order types for position entry. After the position is entered TP1 is placed (identifiable on the price chart). TP1 has a twofold purpose:
Acts as a legitimate profit target to exit 50% of the position.
Once TP1 is closed over, the initial stop loss is converted to a trailing stop, and the long position remains active so long as price continues to uptrend.
For short positions, Counter Strike IQ places a stop-market order at the AI-identified support point. If price violates this level a market order will be placed and a short position entered. Again, this is how the algorithm trades, users can elect to use a stop-limit order amongst other order types for position entry. Upon entry TP1 is placed (identifiable on the price chart). TP1 has a twofold purpose:
Acts as a legitimate profit target to exit 50% of the position.
Once TP1 is closed over, the initial stop loss is converted to a trailing stop, and the short position remains active so long as price continues to downtrend.
As a trading system, Counter Strike IQ exits TP1 using a limit order, with all stop losses exited as stop market orders.
What Classifies As a Tradable Upside Breakout or Tradable Downside Breakout?
For Counter Strike IQ, tradable price breakouts are not manually set but are instead learned by the system. What qualifies as a significant upside or downside breakout in one market might not hold the same significance in another. Counter Strike IQ continuously analyzes historical and current support/resistance levels, how far price has extended from those levels, the raw-dollar price move leading up to a violation of those levels, their longevity, and more, to determine which future levels have a higher chance of breaking out when retested!
The image above illustrates the Strike Channel and explains the corresponding prices and levels
The green upper line represents the Long Breakout Point.
The pink lower line represents the Short Breakout Point.
Any price between the two deviation points is considered “Acceptable”.
The image above shows a long position being entered after the Upside Breakout Point was reached.
Green arrows indicate that the strategy entered a long position at the highlighted price level.
Blue arrows indicate that the strategy exited a position, whether at TP1, the initial stop loss, or at the trailing stop.
Blue lines indicate the TP1 level for the current trade. Red lines indicate the initial stop loss price.
If price closes above TP1, the initial stop loss will be replaced with a trailing stop. A blue line (similar to the blue line shown for TP1) will trail price and correspond to the trailing stop price of the trade.
The image above shows the trailing stop price, represented by a blue line, used for the long position!
You can also hover over the trade labels to get more information about the trade—such as the entry price and exit price.
The image above shows a short position being entered after the Downside Breakout Point was reached.
Red arrows indicate that the strategy entered a short position at the highlighted price level.
Blue arrows indicate that the strategy exited a position, whether at TP1, the initial stop loss, or at the trailing stop.
Blue lines indicate the TP1 level for the current trade. Red lines indicate the initial stop loss price.
If price closes below TP1, the initial stop loss will be replaced with a trailing stop. A blue line (similar to the blue line shown for TP1) will trail price and correspond to the trailing stop price of the trade.
The image above shows the trailing stop price, represented by a blue line, used for the short position!
You can also hover over the trade labels to get more information about the trade—such as the entry price and exit price.
IQ Gradient Graph
The IQ Gradient Graph provides a macro characterization of extreme prices.
The lower macro extremity of the IQ Gradient Graph is colored green, while the upper macro extremity is colored red.
Minimum Profit Target And Stop Loss
The Minimum ATR Profit Target and Minimum ATR Stop Loss setting control the minimum allowed profit target and stop loss distance. On most timeframes users won’t have to alter these settings; however, on very-low timeframes such as the 1-minute chart, users can increase these values so gross profits exceed commission.
After changing either setting, Counter Strike IQ will retrain on historical data - accounting for the newly defined minimum profit target or stop loss.
AI Direction
The AI Direction setting controls the trade direction Counter Strike IQ is allowed to take.
“Trade Longs” allows for long trades.
“Trade Shorts” allows for short trades.
EMA Filter
The EMA Filter setting controls whether the AI should implement an EMA trading filter. Simply, if the EMA Filter is active, long trades can only initiate if price is trading above the user-defined EMA. Conversely, short trades can only initiate if price is trading below the user-defined EMA.
The image above shows the EMA Filter in action!
Verifying Counter Strike IQ’s Effectiveness
Counter Strike IQ automatically tracks its performance and displays the profit factor for the long strategy and the short strategy it uses. This information can be found in the table located in the top-right corner of your chart showing.
This table shows the long strategy profit factor and the short strategy profit factor.
The image above shows the long strategy profit factor and the short strategy profit factor for Counter Strike IQ.
A profit factor greater than 1 indicates a strategy profitably traded historical price data.
A profit factor less than 1 indicates a strategy unprofitably traded historical price data.
A profit factor equal to 1 indicates a strategy did not lose or gain money when trading historical price data.
Using Counter Strike IQ
While Counter Strike IQ is a full-fledged trading system with entries and exits - manual traders can certainly make use of its on chart indications and visualizations.
The hallmark feature of Counter Strike IQ is its ability to signal a breakout near its origin point. Long entries are often signaled near the start of a large upside price move; short entries are often signaled near the start of a large downside price move.
For live analysis, the Strike Channel serves as a valuable tool for identifying breakout points.
The further price moves toward the Upside Breakout Point (green), the stronger the indication that price might breakout to the upside. Conversely, the deeper price reaches toward the Downside Breakout Point (red), the stronger the indication that price might breakout to the downside.
Of course, should buying or selling pressure stall, price may fail to breakout at the identified breakout level. This is a natural consequence of any breakout trading strategy!
With this information at hand, traders can quickly switch between charts and timeframes to identify optimized areas of interest.
Triple EMA Crossover StrategyTriple EMA Crossover Strategy
Overview
The Triple EMA Crossover Strategy is a trend-following trading system that utilizes three Exponential Moving Averages (EMAs) to identify potential entry and exit points in the market. This strategy is based on the principle that when shorter-term prices cross above longer-term prices, it can indicate a bullish trend, and conversely when they cross below, it can signal a bearish trend.
Components
Exponential Moving Averages (EMAs):
Short EMA: A fast-moving average that reacts quickly to price changes (commonly set to 9 periods).
Medium EMA: A medium-term average that smooths out price data and helps confirm trends (commonly set to 21 periods).
Long EMA: A slow-moving average that helps identify the overall trend direction (commonly set to 55 periods).
Trading Signals:
Buy Signal: A long entry is triggered when:
The Short EMA (9) crosses above the Medium EMA (21).
The Medium EMA (21) is above the Long EMA (55).
Sell Signal: A short entry is signaled when:
The Short EMA (9) crosses below the Medium EMA (21).
The Medium EMA (21) is below the Long EMA (55).
Stop Loss and Take Profit:
Stop Loss: Implement a predefined percentage or ATR-based stop loss to limit potential losses.
Take Profit: Set a target based on a risk-to-reward ratio that reflects your trading strategy's goals.
Advantages
Trend Identification: The EMA crossover system allows traders to identify the current trend dynamically, focusing on upward or downward price movements.
Simplicity: The strategy is straightforward, making it accessible for both new and experienced traders.
Flexibility: This method can be applied across multiple timeframes and asset classes, making it versatile for various trading styles.
Disadvantages
Lagging Indicator: Moving averages are lagging indicators, meaning signals may come later than the actual price movement, which can lead to missed opportunities.
Whipsaw Effect: In ranging markets, the strategy may produce false signals leading to potential losses.
TS CalculatorWhat is Trailing Stop?
A trailing stop is a type of stop-loss order that adjusts itself as the price of an asset moves in a favorable direction. It’s designed to lock in profits or limit losses by following the asset’s price movement. Here’s how it works:
How a Trailing Stop Works
Initial Setup: You set a trailing stop at a certain percentage or dollar amount below (for long trades) or above (for short trades) the current market price.
Price Movement: As the price moves in your favor, the trailing stop moves with it, maintaining the set distance.
Locking in Profits: If the price reverses direction by the set amount, the trailing stop triggers a market order to sell (for long trades) or buy (for short trades), locking in your profits or limiting your losses.
Example
Long Trade: If you buy a stock at $100 and set a trailing stop at 10%, the stop-loss order will initially be at $90. If the stock price rises to $120, the trailing stop moves up to $108 (10% below $120). If the price then drops to $108, the trailing stop triggers a sell order.
Short Trade: If you short a stock at $100 and set a trailing stop at 10%, the stop-loss order will initially be at $110. If the stock price falls to $80, the trailing stop moves down to $88 (10% above $80). If the price then rises to $88, the trailing stop triggers a buy order.
Benefits
Automated Risk Management: It helps manage risk without the need to constantly monitor the market.
Profit Protection: It locks in profits as the price moves in your favor.
Flexibility: It adjusts dynamically with the market price, unlike a fixed stop-loss order.
What this script does ?
This script plots the Trailing Stop from the point of entry to current date, until it hits the trailing stop. Some of the market did not give the trailing stop values exactly so this script may give you a wise view of that.
Variables
Date : Date with YYYY-MM-DD format
Time : Time with HH:MM:SS format
Entry Price : Activation Price of TS order
Bounceback Ratio : Ratio for TS
Order Type : Position of order as Long/Short
There is an also a table implemented which shows
Entry
Ratio
Position
Current Stop
For possible updates feel free to contact me via DM.
SL ManagerSTOP LOSS MANAGER
Overview:
The "SL Manager" indicator is designed to assist traders in managing their stop loss (SL) and take profit (TP) levels for both long and short positions. This tool helps you visualize intermediate levels, enhancing your trading decisions by providing crucial information on the chart.
Usage:
This indicator is particularly useful for traders who want to manage their trades more effectively by visualizing potential adjustment points for their stop loss and take profit levels. It helps in making informed decisions to maximize profits and minimize risks by providing clear levels to take partial profits and adjust stop losses.
Features:
Position Input: Select between "long" and "short" positions.
Entry Price: Specify the entry price of your trade.
Take Profit: Define the price level at which you want to take profit.
Stop Loss: Set the stop loss price level to manage your risk.
Intermediate Levels:
For both long and short positions, the indicator calculates and plots the following intermediate levels:
50% Take Profit (TP 50%): Midway between the entry price and the take profit level, where you can take partial profits and move your SL up to the 25% mark.
75% Take Profit (TP 75%): Three-quarters of the way from the entry price to the take profit level, where you can take partial profits and move your SL to breakeven.
Stop Loss Move to 25% (SL Move to 25%): A level where the stop loss can be adjusted to lock in profits.
Visualization:
The indicator plots the calculated levels directly on the chart, provided the data for the current day is available. Different color codes and line styles distinguish between the various levels:
TP 50% and TP 75% are plotted in green.
SL Move to 25% is plotted in red .
Entry/Breakeven is plotted in blue.
IsAlgo - Manual Channel► Overview:
Manual Channel is a strategy that allows traders to manually insert channel lines and set the lines’ width. Trades are opened when the price hits one of the lines and bounces back, with the expectation that it will move towards the opposite line. This strategy offers flexibility in configuring channel lines and trading behavior.
► Description:
The Manual Channel strategy is based on the use of manually defined channel lines to guide trading decisions. Traders start by marking four key points on the chart to create the channel. The first two points share the same time but different prices, and the last two points also share the same time but different prices. This method allows traders to place the channel lines precisely based on their analysis and insights. Additionally, the strategy allows for adjusting the width of the channel lines, which acts as a buffer zone around the main lines.
Once the channel is established, the strategy continuously monitors the price movements in relation to these lines. When the price touches one of the channel lines, the strategy opens a trade with the expectation that the price will bounce back and move towards the opposite line. For example, if the price hits the lower channel line, a long trade (buy) might be opened with the anticipation that the price will rise to the upper channel line. Conversely, if the price hits the upper channel line, a short trade (sell) might be opened expecting the price to fall to the lower channel line.
The strategy offers several options for managing trades. Traders can choose to close a trade when the price reaches the opposite channel line, capturing the expected movement within the channel. Additionally, if the price breaks outside the channel, traders have the option to close trades immediately or stop further trade executions to avoid potential losses.
↑ Channel Example:
↓ Channel Example:
► Features and Settings:
⚙︎ Channel: Define the time and prices of the four main points of the channel lines, and set the lines’ width.
⚙︎ Entry Candle: Specify the minimum and maximum body size and the body-to-candle size ratio for entry candles.
⚙︎ Trading Session: Define specific trading hours during which the strategy operates, restricting trades to preferred market periods.
⚙︎ Trading Days: Specify active trading days to avoid certain days of the week.
⚙︎ Backtesting: Perform backtesting for a selected period to evaluate strategy performance. This feature can be deactivated if not needed.
⚙︎ Trades: Configure trade direction (long, short, or both), position sizing (fixed or percentage-based), maximum number of open trades, and daily trade limits.
⚙︎ Trades Exit: Set profit/loss limits, specify trade duration, or exit based on channel breaks.
⚙︎ Stop Loss: Choose from various stop-loss methods, including fixed pips, ATR-based, or highest/lowest price points within a specified number of candles. Trades can also be closed after a certain number of adverse candle movements.
⚙︎ Break Even: Adjust stop loss to break even once predefined profit levels are reached, protecting gains.
⚙︎ Trailing Stop: Implement a trailing stop to adjust the stop loss as the trade becomes profitable, securing gains and potentially capturing further upside.
⚙︎ Take Profit: Set up to three take-profit levels using methods such as fixed pips, ATR, or risk-to-reward ratios. Alternatively, specify a set number of candles moving in the trade’s direction.
⚙︎ Alerts: Comprehensive alert system to notify users of significant actions, including trade openings and closings. Supports dynamic placeholders for take-profit levels and stop-loss prices.
⚙︎ Dashboard: Visual display on the chart providing detailed information about ongoing and past trades, aiding users in monitoring strategy performance and making informed decisions.
► Backtesting Details:
Timeframe: 15-minute EURUSD chart
Initial Balance: $10,000
Order Size: 10 units
Commission: 0.05%
Slippage: 5 ticks
This strategy opens trades around a manually drawn channel, which results in a smaller number of closed trades.
KillZones + ACD Fisher [TradingFinder] Sessions + Reversal Level🔵 Introduction
🟣 ACD Method
"The Logical Trader" opens with a thorough exploration of the ACD Methodology, which focuses on pinpointing particular price levels associated with the opening range.
This approach enables traders to establish reference points for their trades, using "A" and "C" points as entry markers. Additionally, the book covers the concept of the "Pivot Range" and how integrating it with the ACD method can help maximize position size while minimizing risk.
🟣 Session
The forex market is operational 24 hours a day, five days a week, closing only on Saturdays and Sundays. Typically, traders prefer to concentrate on one specific forex trading session rather than attempting to trade around the clock.
Trading sessions are defined time periods when a particular financial market is active, allowing for the execution of trades.
The most crucial trading sessions within the 24-hour cycle are the Asia, London, and New York sessions, as these are when substantial money flows and liquidity enter the market.
🟣 Kill Zone
Traders in financial markets earn profits by capitalizing on the difference between their buy/sell prices and the prevailing market prices.
Traders vary in their trading timelines.Some traders engage in daily or even hourly trading, necessitating activity during periods with optimal trading volumes and notable price movements.
Kill zones refer to parts of a session characterized by higher trading volumes and increased price volatility compared to the rest of the session.
🔵 How to Use
🟣 Session Times
The "Asia Session" comprises two parts: "Sydney" and "Tokyo." This session begins at 23:00 and ends at 06:00 UTC. The "Asia KillZone" starts at 23:00 and ends at 03:55 UTC.
The "London Session" includes "Frankfurt" and "London," starting at 07:00 and ending at 14:25 UTC. The "London KillZone" runs from 07:00 to 09:55 UTC.
The "New York" session starts at 14:30 and ends at 19:25 UTC, with the "New York am KillZone" beginning at 14:30 and ending at 22:55 UTC.
🟣 ACD Methodology
The ACD strategy is versatile, applicable to various markets such as stocks, commodities, and forex, providing clear buy and sell signals to set price targets and stop losses.
This strategy operates on the premise that the opening range of trades holds statistical significance daily, suggesting that initial market movements impact the market's behavior throughout the day.
Known as a breakout strategy, the ACD method thrives in volatile or strongly trending markets like crude oil and stocks.
Some key rules for employing the ACD strategy include :
Utilize points A and C as critical reference points, continually monitoring these during trades as they act as entry and exit markers.
Analyze daily and multi-day pivot ranges to understand market trends. Prices above the pivots indicate an upward trend, while prices below signal a downward trend.
In forex trading, the ACD strategy can be implemented using the ACD indicator, a technical tool that gauges the market's supply and demand balance. By evaluating trading volume and price, this indicator assists traders in identifying trend strength and optimal entry and exit points.
To effectively use the ACD indicator, consider the following :
Identifying robust trends: The ACD indicator can help pinpoint strong, consistent market trends.
Determining entry and exit points: ACD generates buy and sell signals to optimize trade timing.
Bullish Setup :
When the "A up" line is breached, it’s wise to wait briefly to confirm it’s not a "Fake Breakout" and that the price stabilizes above this line.
Upon entering the trade, the most effective stop loss is positioned below the "A down" line. It's advisable to backtest this to ensure the best outcomes. The recommended reward-to-risk ratio for this strategy is 1, which should also be verified through backtesting.
Bearish Setup :
When the "A down" line is breached, it’s prudent to wait briefly to ensure it’s not a "Fake Breakout" and that the price stabilizes below this line.
Upon entering the trade, the most effective stop loss is positioned above the "A up" line. Backtesting is recommended to confirm the best results. The recommended reward-to-risk ratio for this strategy is 1, which should also be validated through backtesting.
Advantages of Combining Kill Zone and ACD Method in Market Analysis :
Precise Trade Timing : Integrating the Kill Zone strategy with the ACD Method enhances precision in trade entries and exits. The ACD Method identifies key points for trading, while the Kill Zone focuses on high-activity periods, together ensuring optimal timing for trades.
Better Trend Identification : The ACD Method’s pivot ranges help spot market trends, and when combined with the Kill Zone’s emphasis on periods of significant price movement, traders can more effectively identify and follow strong market trends.
Maximized Profits and Minimized Risks : The ACD Method's structured approach to setting price targets and stop losses, coupled with the Kill Zone's high-volume trading periods, helps maximize profit potential while reducing risk.
Robust Risk Management : Combining these methods provides a comprehensive risk management strategy, strategically placing stop losses and protecting capital during volatile periods.
Versatility Across Markets : Both methods are applicable to various markets, including stocks, commodities, and forex, offering flexibility and adaptability in different trading environments.
Enhanced Confidence : Using the combined insights of the Kill Zone and ACD Method, traders gain confidence in their decision-making process, reducing emotional trading and improving consistency.
By merging the Kill Zone’s focus on trading volumes and the ACD Method’s structured breakout strategy, traders benefit from a synergistic approach that enhances precision, trend identification, and risk management across multiple markets.
Quantum Duality Predictive Ranges### Quantum Duality Predictive Ranges v1.0
This Pine Script is designed to help traders predict price ranges and manage risk dynamically using ATR (Average True Range) calculations. It offers customizable settings, visual indicators, and alerts to assist in identifying trading opportunities and managing risk.
#### Key Features
- **Dynamic Risk Management**: Adjusts risk based on signals and cumulative risk.
- **Predictive Ranges**: Calculates predictive ranges based on ATR and user-defined multipliers.
- **Visual Indicators**: Plots lines and labels for easy visualization of trading signals and risk levels.
- **Alerts and Table**: Provides alerts for trading signals and displays a table with relevant trading data.
#### User Inputs
**EA Account Settings**
- **Initial Risk fixed in USD $**: Sets the initial risk amount in USD (default: 18).
- **Signal Multiply Factor for Risk**: Multiplier for signal risk (default: 1.257).
- **Pair Decimals**: Decimal places for pair pricing (default: 2).
**Trade Settings**
- **ATR Length**: Length for ATR calculation (default: 198).
- **ATR Factor**: Multiplier for ATR (default: 6.0).
- **ATR Source**: Source for ATR calculation (default: close).
- **ATR Multiplier**: Multiplier for defining RANGE Top/Bottom Levels (default: 0.45).
- **Inner Range Multiplier**: Multiplier for defining TP1 (default: 2.01).
- **Outer Range Multiplier**: Multiplier for defining TP2 (default: 3.0).
- **Spans Multiplier**: Multiplier for defining SL (default: 0.36).
**Display Options**
- **Display Table**: Option to display a table (default: true).
- **Display Labels for potential Gain and Loss**: Option to display gain/loss labels (default: true).
- **Display Labels for Bar counts since current Range**: Option to display bar counts (default: true).
- **Display Labels for Signals**: Option to display signal labels (default: true).
- **Line Width**: Width of the lines plotted (default: 1).
- **Line Transparency**: Transparency of the lines (default: 10).
- **Fill Transparency**: Transparency of the fill between lines (default: 75).
#### How It Works
1. **Predictive Ranges Calculation**:
- Calculates predictive ranges based on ATR, holds ATR values, and updates average values when price crosses defined levels.
2. **Risk Management and Signal Logic**:
- Counts the number of signals.
- Calculates cumulative and total risk based on signals.
- Resets signals and risk when price crosses predictive ranges.
3. **Entry Points and Potential Gains/Losses**:
- Determines buy and sell entry points.
- Calculates potential gains and losses for both buy and sell signals.
- Resets values when a new average range is established.
4. **Plotting and Alerts**:
- Plots lines for predictive ranges, spans, and stop loss levels.
- Displays labels for signals and potential gains/losses.
- Provides alerts for buy and sell signals with defined take profit and stop loss levels.
5. **Custom Ticker**:
- Renames tickers based on predefined rules (e.g., SPX500USD to SPX500).
#### Usage
1. **Set Up**:
- Adjust the input parameters in the settings menu to match your trading preferences and risk management strategy.
2. **Visualize**:
- View the plotted lines and labels on the chart to identify potential trading signals and manage risk.
3. **Alerts**:
- Enable alerts to receive notifications for buy and sell signals.
4. **Table**:
- Use the table to see a summary of important trading data, such as total risk and target levels.
This script provides a robust framework for managing risk and identifying trading opportunities using predictive ranges based on ATR. Happy trading!
Pullback_Power [JackTz]Welcome to Pullback_Power
Pullback_Power is a scalping strategy designed to capitalize on market retracements while incorporating unique dynamic features to enhance profitability.
Calculation
Pullback_Power purely uses moving averages to calculate both entry and exits. Exits can also be set to fixed percentages for both take profit and stop loss.
How the Strategy Works
Statistics show that markets normally do a recovery after each drop. Crypto markets can easily drop up to 20% within a few hours and then do a complete or partial recovery. Pullback_Power utilizes this known pattern alongside pyramiding. The strategy aims to catch one or more entries when the price drops, hoping to make profits when the market recovers from the drop. The fixed take profit and stop loss can be used to define your risk management, while the dynamic exit opportunity is riskier but provides the ability to stay in the trade longer while it recovers. Pullback_Power can make up to four entries. This means it utilizes pyramiding to spread out the entry points, but every exit is a full exit. It is not possible to partially exit.
Utility
Pullback_Power is a scalping strategy suitable for traders who operate with small trades and don't want to stay in the market for too long. Pullback_Power offers precise signals with no repainting. The strategy thrives in volatility, so crypto pairs might yield the best results, although this strategy can be adapted to work on all pairs and markets.
How to Automate It
Pullback_Power utilizes the standard placeholders of strategies on TradingView. This enables the trader to add every data point into a webhook, making it fully flexible to suit every trader's needs. To automate, create an alert, set the webhook URL, and add the JSON body needed for the webhook. An example of a simple JSON webhook with some of the standard strategy placeholders:
{
"side": "{{strategy.order.action}}",
"symbol": "{{ticker}}",
"amount": "{{strategy.order.contracts}}"
}
Read about all the standard placeholders that you can use here: TradingView - Standard strategy placeholders
Originality
Pullback_Power is unique in its ability to create precise signals without repainting while maintaining a solid approach to the pullback strategy. Its simplicity not only makes the strategy easy to use and understand but also highly effective. The simplicity reduces inputs, eliminating overfitting and limits each input to avoid incorrect usage. Many times, default settings are enough to achieve good backtesting results on almost all pairs available. Pullback_Power also differs from many other strategies by its solid code, which enhances performance and provides more reliable backtesting. The clean code increases the resilience and precision of the entries, making it less prone to errors.
Many pullback/scalping strategies normally only works on specific scopes of timeframes or pairs. Pullback_Power can easily be adapted to work on almost every scenario. The biggest change needed is the length of the moving average. The lower the timeframe, the higher a length is needed for proper results. I.e. on a 2H timeframe a length of 3 can yield good results. On a 5min timeframe the length might need to be as high as 70.
How to Use
To use Pullback_Power, add the script to your trading chart. By default, Pullback_Power opens four orders to optimize trade opportunities with a default fee value set at 0.1%. You can change these default settings in the Settings window under the Properties tab. To tailor Pullback_Power to your individual trading style, navigate to the Settings under the Input tab. Here you can configure various inputs to fit your trading style.
- Backtest settings , Start Date:
Defines the date of when the calculation starts. Use this to set the date of when the first trade could potentially emit.
- Backtest settings , End Date:
Defines the date of when the calculation ends. If there are any open trades after this date the close calculations are still live. It only makes sure that new orders cannot be opened after this date.
- Backtest settings , Only trade on weekdays:
This is a toggle you can enable or disable. If enabled it only allows new entries to happen during the normal week days, meaning Monday, Tuesday, Wednesday, Thursday and Friday.
Disable this to enable the script to open trades on all 7 days of the week.
- Open settings , Use dynamic long positions:
This toggle allows you to enable or disable the pullback level calculations after first trade.
If enabled, the calculations of level 2, 3 and 4 continues to happen after each bar, making the levels follow the price with the moving averages calculations.
If disabled, the calculations of the levels stop after the first trade. This means that the levels calculation at the point of the first trade stay fixed until all trades are closed.
You can see the difference of the green lines on the chart when you toggle this flag.
- Open settings , Data type:
This is the bar data used for the moving average calculation when opening trades. The possible data types are Open, High, Low, Close, HL2, HLC3, OHLC4, OC2 and HC2.
- Open settings , Source type:
This is the source used to calculate the moving average. The types available are: SMA, PCMA, EMA, WMA, DEMA, ZLEMA and HMA.
- Open settings , Length:
This is the length used for the moving average calculations. 3 means it takes the last 3 bars of historical data for the calculation.
- Open settings , Offset:
This defines if the calculation should use an offset for the historical data. This does not use a look-forward feature, but a look-backward feature. To prevent any possible repaints the offset can only be positive, not negative.
For instance, if the length is 3 and the offset is 0 the calculation is made from the last 3 bars, making it bar1, bar2 and bar3. If the length is 3 and the offset is 1 the calculation is made from bar2, bar3, and bar4 – offsetting the calculation by 1 bar.
- Leverage settings , Leverage liquidation (1-125):
The script itself does not handle any custom leverage calculation – this must be done in the Properties tabs and increasing the order size.
This setting is made to test a possible liquidation event if using leverage.
By setting this to higher than 1, a red line is visible after the first trade on the chart. This indicates the liquidation price.
If this setting is set to 25, the script will calculate the liquidation price from a x25 leverage. If this price is hit, the scripts stops emitting any orders and the background turns red.
You can use this to test if your settings could handle a certain level of leverage.
- Pullback settings , Pullback 1, 2, 3 and 4:
Each of these settings defines the entry price of each pullback level. If Pullback 1 is set to -6 it means that the moving average calculation should be 6% lower than the actual price.
The same logic applies to Pullback 2, 3 and 4.
Setting any level to 0 will disable the level – eliminating any orders to emit on that level.
This can be used to change the level of pyramiding down from 4 if needed.
If you do this, remember to also change the order size and the pyramiding value in the Properties tab accordingly.
- Close settings , Use dynamic TP and SL:
If enabled, script will exit all orders using the same but separate algorithm for moving averages. This enables the user to define if you want the orders to be closed if the price level of this moving average is hit. The price level for this calculation is visible on the chart by the blue line.
Although you can change the length and offset, as described underneath, this calculation uses the same data and source type defined in the Open settings area.
- Close settings , Length, Close:
This is the length used for the closing moving average calculations. 3 means it takes the last 3 bars of historical data for the calculation.
- Close settings , Offset, Close:
This defines if the calculation for the closing moving average should use an offset for the historical data. Just as the offset used for opening order, this does not use a look-forward feature, but a look-backward feature. To prevent any possible repaints the offset can only be positive, not negative.
For instance, if the length is 3 and the offset is 0 the calculation is made from the last 3 bars, making it bar1, bar2 and bar3. If the length is 3 and the offset is 1 the calculation is made from bar2, bar3, and bar4 – offsetting the calculation by 1 bar.
- Close settings , Use TakeProfit:
This toggle enables/disables a fixed take profit percentage.
- Close settings , TP %:
This sets the wanted % to reach on a take profit. This setting is ignored if the toggle above is disabled.
- Close settings , Use StopLoss:
This toggle enables/disables a fixed stop loss percentage.
- Close settings , SL %:
This sets the wanted % to reach on a stop loss. This setting is ignored if the toggle above is disabled.
Exit on Same Bar as Entry
By default, the script doesn't emit any exit orders on the same bar as the first entry order. Enable "Recalculation: After order is filled" to change this behavior.
Troubleshooting
While Pullback_Power is designed to provide reliable trading signals, you may encounter rare issues. One such issue could be receiving an error message stating "can't open orders with 0 or negative qty." If you encounter this error, it is likely due to specific conditions on the selected timeframe. To resolve this issue, change the timeframe on your trading chart.
Underlying Principles and Value Proposition
Pullback_Power leverages moving averages and volatility behavior to identify market retracements and capitalize on them. The strategy is rooted in the understanding that markets often experience temporary reversals or "pullbacks" before resuming their primary trend. By identifying these pullbacks and entering trades at opportune moments, Pullback_Power aims to capture quick profits from short-term market movements.
The dynamic and fixed calculations of Take Profit (TP) and Stop Loss (SL) levels enhances risk management, ensuring that potential losses are controlled while allowing room for profits to grow. The adaptive approach using the moving averages considers current market conditions, making the strategy flexible and responsive to changing volatility.
Moreover, Pullback_Power's non-repainting nature ensures the reliability of its signals, eliminating hindsight bias and providing traders with actionable insights based on real-time market data.
The strategy's simplicity and effectiveness make it accessible for traders of all experience levels. Whether you're a beginner looking to start scalping or an experienced trader seeking to diversify your trading approach, Pullback_Power offers a balanced blend of simplicity and sophistication to help you navigate the markets with confidence.
By focusing on clear, transparent principles and offering practical tools for risk management, Pullback_Power aims to provide tangible value to traders, empowering them to make informed decisions and optimize their trading outcomes.
Thank you for choosing Pullback_Power. I wish you successful trading!
Multi-Pairs Stratrgy Backtesting ScreenerThis indicator is for viewing and checking the results of a specific strategy simultaneously on 25 currency pairs. Results such as number of trades, wins, losses, canceled trades and most importantly win rate.
Long condition is as follows:
Short condition is as follows:
An Alert Fibo Level is built in to indicate the buy or sell status.
Reset Deal Calculation Fibo Level , if the price hits it, the indicator resets all calculations and prepares for the next situation.
If Other situation appear after missed situation, indicator consider it:
All statistics collected in Screener Table :
Date Period:
Users can customize the date period during which the strategy is tested, allowing for a more granular analysis of performance over specific timeframes.
Entry:
Entry is based on Fibonacci level between the Lower Low and Higher High pivots for Long deals.
Entry is based on Fibonacci level between the Higher High and Lower Low pivots for Short deals.
Allowing a second entry
There is a feature that If the risk-to-reward ratio is below the specified input (rr), the trading deal wont initiate.
Stop Loss:
Adjustable based on Fibonacci levels , Base Pivot, Percent and ATR.
The Base Pivot is calculate from LL pivot point for Long and HH pivot point for short (not Entry price).
The Percent and ATR is calculate from Entry price.
Targets:
Adjustable based on Source, Fibonacci levels , Percent and ATR.
Source indicates the maximum (minimum) value between the open and close of the candle where the Higher High (Lower Low) pivot point was formed for Long (Short) deals.
Percent and ATR calculates from Entry 1 Price
Exit Methods :
The goal is to offer users a diverse set of exits before the price touches the target or stop loss.
1. Pending Entry Time-out
cancel pending entry based on candle counting since alert fired. (before deal started)
2. Active Deal Reverse
If a deal (long or short position) is currently open, and the reverse signal is emitted, the script will close the existing deal.
3. Reverse Deal Exit
If a deal (long or short position) is currently open, and the reverse signal is emitted, the script will automatically close the existing deal.
4. Move Exit
With this method, if Entry 2 is triggered, the deal will be closed when the price touches the Entry price.
5. Candle Counting Exit
This exit type is based on the number of candles since the deal started.
TradeTale Reversal Alert 🚀This script explains how RSI Oscillator along with Bollinger Bands & Moving Average can be used to catch "Reversal Points".
What is an Oscillator:-
An oscillator is a technical analysis tool that constructs high and low bands between two extreme values and then builds a trend indicator that fluctuates within these bounds. Traders use the trend indicator to discover short-term overbought or oversold conditions. RSI with MA is used along with minor calculations (maths) in this Oscillator for generating Long and Short signals.
RSI:-
RSI is a momentum oscillator which measures the speed and change of price movements. RSI moves up and down (oscillates) between ZERO and 100. Generally RSI above 70 is considered overbought and below 30 is considered oversold. Some traders may use a setting of 20 and 80 for oversold and overbought conditions respectively. Some traders may use a setting of 10 and 90 for oversold and overbought conditions respectively. However this may reduce the number of signals. 10 to 30 is shown as bullish zone and 70 to 90 is shown as bearish zone in this Oscillator.
Calculation:-
There are three basic components in the RSI - Avg Gain, Avg Loss & RS.
Avg Gain = Average of Upward Price Change
Avg Loss = Average of Downward Price Change
RS = (Avg Gain)/(Avg Loss)
RSI = 100 – (100 / (1 +RS ))
First Calculation:-
RSI calculation is based on default 14 periods.
Average gain and Average loss are simple 14 period averages.
Average Loss equals the sum of the losses divided by 14 for the first calculation.
Average Gain equals the sum of the Gains divided by 14 for the first calculation.
First Average Gain = Sum of Gains over the past 14 periods / 14.
First Average Loss = Sum of Losses over the past 14 periods / 14.
The formula uses a positive value for the average loss.
RS values are smoothed after the first calculation.
Second Calculation:-
Subsequent calculations multiply the prior value by 13, add the most recent value, and divide the total by 14.
Average Gain = / 14.
Average Loss = / 14.
if
Average Loss = 0, RSI = 100 (means there were no losses to measure).
Average Gain = 0, RSI = 0 (means there were no gains to measure).
Moving Average (MA):-
A moving average (MA) is used in technical analysis, used to help smooth out price data by creating a constantly updated average price. A rising moving average indicates that the security is in an uptrend, while a declining moving average indicates a downtrend.
Bollinger Bands (BB):–
It is consists of a Moving Average line and two standard deviation lines that are plotted above and below the moving average line. The moving average periods & standard deviation can be adjust according to the preference. Bollinger Bands help traders to identify the volatility and potential price range of security.
Logic of this indicator:-
RSI is an oscillator that fluctuates between zero and 100 which makes it easy to use for many traders. Its easy to identify extremes because RSI is range-bound.
Bollinger Band Upper and Lower Bands are used to identify Overbought & Oversold points Respectively. Price crossover of these Upper & Lower Bands used to calculate Reversal Points.
BB, RSI and MA calculations along with maths is used to generate signals.
Rocket signal in is Long Signal and also exit Short signal. (Bullish Entry/Exit)
Bear signal is Short Signal and also exit Long signal. (Bearish Entry/Exit)
But remember that RSI works best in range bound market and is less trustworthy in trending markets. (caution)
A new trader need to be cautious because during strong trends in the market/security, RSI may remain in overbought (70 to 90) or oversold (10 to 30) for extended periods.
Also Bollinger Bands here are used to calculate range reversal, So is less trustworthy in trending markets. (caution)
Chart Timeframe:-
This Indicator works on all timeframes.
Traders should set stop loss and take profit levels as per risk reward ratio.
Note:
Don't confuse RSI and relative strength. RSI is changes in the price momentum of a security.
whereas relative strength compares the price performance of two or more securities.
Like other technical indicators, This indicator also is not a holy grail. It can only assist you in building a good strategy. You can only succeed with proper position sizing, risk management and following correct trading Psychology (No overtrade, No greed, No revenge trade etc).
THIS INDICATOR IS FOR EDUCATIONAL PURPOSE AND PAPER TRADING ONLY. YOU MAY PAPER TRADE TO GAIN CONFIDENCE AND BUILD FURTHER ON THESE. PLEASE CONSULT YOUR FINANCIAL ADVISOR BEFORE INVESTING. WE ARE NOT SEBI REGISTERED.
Hope you all like it
happy learning.
TradeTale OscillatorThis script explains how Oscillator can be used to catch market moves within a Range.
What is an Oscillator:-
An oscillator is a technical analysis tool that constructs high and low bands between two extreme values and then builds a trend indicator that fluctuates within these bounds. Traders use the trend indicator to discover short-term overbought or oversold conditions. RSI with MA is used along with minor calculations (maths) in this Oscillator for generating Long and Short signals.
RSI:-
RSI is a momentum oscillator which measures the speed and change of price movements. RSI moves up and down (oscillates) between ZERO and 100. Generally RSI above 70 is considered overbought and below 30 is considered oversold. Some traders may use a setting of 20 and 80 for oversold and overbought conditions respectively. Some traders may use a setting of 10 and 90 for oversold and overbought conditions respectively. However this may reduce the number of signals. 10 to 30 is shown as bullish zone and 70 to 90 is shown as bearish zone in this Oscillator.
Calculation:-
There are three basic components in the RSI - Avg Gain, Avg Loss & RS.
Avg Gain = Average of Upward Price Change
Avg Loss = Average of Downward Price Change
RS = (Avg Gain)/(Avg Loss)
RSI = 100 – (100 / (1 +RS ))
First Calculation:-
RSI calculation is based on default 14 periods.
Average gain and Average loss are simple 14 period averages.
Average Loss equals the sum of the losses divided by 14 for the first calculation.
Average Gain equals the sum of the Gains divided by 14 for the first calculation.
First Average Gain = Sum of Gains over the past 14 periods / 14.
First Average Loss = Sum of Losses over the past 14 periods / 14.
The formula uses a positive value for the average loss.
RS values are smoothed after the first calculation.
Second Calculation:-
Subsequent calculations multiply the prior value by 13, add the most recent value, and divide the total by 14.
Average Gain = / 14.
Average Loss = / 14.
if
Average Loss = 0, RSI = 100 (means there were no losses to measure).
Average Gain = 0, RSI = 0 (means there were no gains to measure).
Moving Average (MA):-
A moving average (MA) is used in technical analysis, used to help smooth out price data by creating a constantly updated average price. A rising moving average indicates that the security is in an uptrend, while a declining moving average indicates a downtrend.
Logic of this indicator:-
RSI is an oscillator that fluctuates between zero and 100 which makes it easy to use for many traders.
Its easy to identify extremes because RSI is range-bound.
RSI and MA calculations along with maths is used to generate signals.
Rocket signal in white colour is Long Signal and also exit Short signal. (Bullish Entry/Exit)
Scissor signal in orange colour is Short Signal and also exit long signal. (Bearish Entry/Exit)
Green colour band shows bullish momentum & Red colour band shows bearish momentum.
But remember that RSI works best in range bound market and is less trustworthy in trending markets. (caution)
A new trader need to be cautious because during strong trends in the market/security, RSI may remain in overbought (70 to 90) or oversold (10 to 30) for extended periods.
Chart Timeframe:-
This Oscillator works on all timeframes.
Traders should set stop loss and take profit levels as per risk reward ratio.
Note:
Don't confuse RSI and relative strength. RSI is changes in the price momentum of a security.
whereas relative strength compares the price performance of two or more securities.
Like other technical indicators, This Oscillator also is not a holy grail. It can only assist you in building a good strategy. You can only succeed with proper position sizing, risk management and following correct trading Psychology (No overtrade, No greed, No revenge trade etc).
THIS OSCILLATOR IS FOR EDUCATIONAL PURPOSE AND PAPER TRADING ONLY. YOU MAY PAPER TRADE TO GAIN CONFIDENCE AND BUILD FURTHER ON THESE. PLEASE CONSULT YOUR FINANCIAL ADVISOR BEFORE INVESTING. WE ARE NOT SEBI REGISTERED.
Hope you all like it
happy learning.
RSI 11 IndicatorThis script explains how RSI can be used to catch market moves in trend, reversal or sideways market.
What is RSI indicator:-
RSI is a momentum oscillator which measures the speed and change of price movements. RSI moves up and down (oscillates) between ZERO and 100. Generally RSI above 70 is considered overbought and below 30 is considered oversold. Some traders may use a setting of 20 and 80 for oversold and overbought conditions respectively. However this may reduce the number of signals. You can also use RSI to identify divergences, strength, reversals, general trend etc.
Calculation:-
There are three basic components in the RSI - Avg Gain, Avg Loss & RS.
Avg Gain = Average of Upward Price Change
Avg Loss = Average of Downward Price Change
RS = (Avg Gain)/(Avg Loss)
RSI = 100 – (100 / (1 +RS ))
First Calculation:-
RSI calculation is based on default 14 periods.
Average gain and Average loss are simple 14 period averages.
Average Loss equals the sum of the losses divided by 14 for the first calculation.
Average Gain equals the sum of the Gains divided by 14 for the first calculation.
First Average Gain = Sum of Gains over the past 14 periods / 14.
First Average Loss = Sum of Losses over the past 14 periods / 14.
The formula uses a positive value for the average loss.
RS values are smoothed after the first calculation.
Second Calculation:-
Subsequent calculations multiply the prior value by 13, add the most recent value, and divide the total by 14.
Average Gain = / 14.
Average Loss = / 14.
if
Average Loss = 0, RSI = 100 (means there were no losses to measure).
Average Gain = 0, RSI = 0 (means there were no gains to measure).
Logic of this indicator:-
RSI is an oscillator that fluctuates between zero and 100 which makes it easy to use for many traders.
Its easy to identify extremes because RSI is range-bound.
But remember that RSI works best in range bound market and is less trustworthy in trending markets.
A new trader need to be cautious because during strong trends in the market/security, RSI may remain in overbought or oversold for extended periods.
Chart Timeframe:-
RSI indicator works well on all timeframes.
Timeframe depends on which strategy or settings are you using.
Generally a lower timeframe like 1 min, 3 min, 5 min, 15 min, 30 min, 1 Hr etc is used for intraday trades or short duration trades
and higher timeframes like 1 day, 1 week, 1 month are used for positional or long term trades.
Please Read the Idea "Mastering RSI with 11 Strategies" to understand this indicator better.
Indicator 1
Basis Strategy of Overbought and Oversold
Usually an asset with RSI reading of 70 or above indicates a bullish and an overbought situation.
overbought can be seen as trading at a higher price than it should.
traders may expect a price correction or trend reversal and sell the security.
but RSI indicator can stay in the overbought for a long time when the stock is in uptrend - This may trap an immature trader.
an Immature trader will enter a sell position when RSI become overbought (70), whereas a mature trader will enter sell position when RSI line crosses below the overbought line (70).
An asset with RSI reading of 30 or below indicates a bearish and an oversold condition.
oversold can be seen as trading at a lower price than it should.
traders may expect a price correction or trend reversal and buy the security.
but RSI indicator can stay in the oversold for a long time when the stock is in downtrend - This may trap an immature trader.
an Immature trader will enter a buy position when RSI become oversold (30), whereas a mature trader will enter buy position when RSI line crosses above the oversold line (30).
Center dotted Mid line is RSI 50.
Chart RSI is shown in yellow colour.
Red shaded area above the red horizontal line shows the stock or security has entered overbought condition. "R" signal in red shows a likely downside reversal, means it may be a likely Selling opportunity.
Green shaded area below the green horizontal line shows the stock or security has entered oversold condition. "R" signal in green shows a likely upside reversal, means it may be a likely Buying opportunity.
Note:-
so its better to wait for reversal signal.
traders may use 20 instead of 30 as oversold level and 80 instead of 70 as overbought level.
new traders may learn to use the indicator as per the prevailing trend to get better results.
false signals may be avoided by using bullish signals in bullish trend and bearish signals in bearish trend.
Indicator 2
RSI Strength Crossing 50
RSI crossing centreline 50 in the below chart showing strength and buy/sell signal.
Centre line is at RSI 50.
if RSI is above 50 its considered bullish trend. (increasing strength)
if RSI is below 50 its considered bearish trend. (decreasing strength)
RSI crossing centre line (50) upside may be a buy signal.
RSI crossing centre line (50) downside may be a sell signal.
"B" signal in green colour shows that RSI is crossing above Mid 50 horizontal line, which may be a likely Buy signal.
"S" signal in red colour shows that RSI is crossing below Mid 50 horizontal line, which may be a likely Sell signal.
Indicator 3
RSI 40 and RSI 60 Support and Resistance
RSI 40 acting as support in the below chart
In an uptrend RSI tends to remain in the 40 to 90 range with 40 as support (buying opportunity at support).
RSI 60 acting as resistance in the below chart
In a downtrend RSI tends to remain in 10 to 60 range with 60 as resistance (selling opportunity at resistance).
"40" signal in green colour shows that RSI is crossing above 40 horizontal line, which may be a likely Support in making and a Buy signal.
"60" signal in red colour shows that RSI is crossing below 60 horizontal line, which may be a likely Resistance in making and a Sell signal.
Note:-
These ranges may change depending on RSI settings and change in the market trend.
Indicator 4
RSI Divergence
Below chart shows a simple example of Bullish Divergence and Bearish Divergence.
An RSI divergence occurs when price moves in the opposite direction of the RSI.
A bullish divergence is when price is falling but RSI is rising. which means RSI making higher lows and price making lower lows (buy signal).
A bearish divergence is when price is rising but RSI is falling. which means RSI making lower high and price making higher highs (sell signal).
Divergences are more strong when appear in an overbought or oversold condition.
There may be many false signals during a strong uptrend or strong downtrend.
In a strong uptrend, RSI may show many false bearish divergences before finally reversing down.
same way in a strong downtrend, RSI may show many false bullish divergences before finally reversing up.
"Bull Div" signal along with divergence line in green colour shows Bullish Divergence, which may be a likely Buy signal.
"Bear Div" signal along with divergence line in red colour shows Bearish Divergence, which may be a likely Sell signal.
Indicator 5
Double Top & Double Bottom
Double Bottom = RSI goes below oversold (30). RSI comes back above 30. RSI falls back again towards 30 and again rise making a Double bottom. its a signal of buying and likely upside reversal.
Double Top = RSI goes above overbought (70). RSI comes back below 70. RSI rises back again towards 70 and again fall making a Double top. its a signal of selling and likely downside reversal.
Double Bottom is shown with Green Dashed line joining two low's of RSI indicating a likely Buy Signal.
Double Top is shown with Red Dashed line joining two High's of RSI indicating a likely Sell Signal.
Indicator 6
Trendline Support and Resistance
Below chart shows RSI Trendline Resistance and Support
RSI resistance trendline = Connect three or more points on the RSI line as it falls to draw a RSI downtrend line (RSI resistance trendline).
Everytime it takes resistance from a RSI downtrend line its a selling opportunity.
RSI support trendline = Connect three or more points on the RSI line as it rises to draw a RSI uptrend line (RSI support trendline).
Everytime it takes support on a RSI uptrend line its a buying opportunity.
RSI Resistance trendline shown in Red colour indicating a likely fall again after rejection from this Red trendline till the time RSI breaks above it to change the trend from Bearsih to Bullish.
RSI support trendline shown in Green colour indicating a likely Rise again after support from this Green trendline till the time RSI breaks below it to change the trend from Bullish to Bearish.
Indicator 7
Trendline Breakout and Breakdown
Below chart shows RSI Trendline Breakout and Breakdown
RSI resistance trendline Breakout = Connect three or more points on the RSI line as it falls to draw a RSI downtrend line (RSI resistance trendline).
Whenever it breakout above RSI resistance trendline its a buying opportunity.
RSI support trendline Breakdown = Connect three or more points on the RSI line as it rises to draw a RSI uptrend line (RSI support trendline).
Whenever it breakdown below RSI support trendline its a selling opportunity.
Note:-
Correlate both the RSI and the closing price to ensure proper breakout or breakdown.
Challenge is to correctly identify if a breakout or breakdown is sustainable or its a false signal.
Indicator 8
RSI Crossover same timeframe
RSI with two different RSI length crossing each other on same timeframe.
when lower RSI length crossing above higher RSI length its a buy signal.
when lower RSI length crossing below higher RSI length its a sell signal.
for example RSI with length 7 & length 14 on 15 Minutes timeframe.
Green Cross shows that Fast RSI is crossing above Slow RSI on the same timeframe with different RSI length Settings, which means it may be a likely Buy Signal.
Red Cross shows that Fast RSI is crossing below Slow RSI on the same timeframe with different RSI length Settings, which means it may be a likely Sell Signal.
Indicator 9
RSI Crossover Multi timeframe
RSI with same RSI length but on two different timeframes crossing each.
when lower timeframe RSI crossing above higher timeframe RSI its a buy signal.
when lower timeframe RSI crossing below higher timeframe RSI its a sell signal.
for example RSI with length 14 on 5 Minutes and 1 Hr timeframes.
Green Cross shows that Lower Timeframe RSI is crossing above Higher Timeframe RSI with same RSI length Settings, which means it may be a likely Buy Signal.
Red Cross shows that Lower Timeframe RSI is crossing below Higher Timeframe RSI with same RSI length Settings, which means it may be a likely Sell Signal.
Indicator 10
RSI EMA/WMA/SMA Crossover
when RSI crossing above EMA/WMA/SMA its a buy signal.
when RSI crossing below EMA/WMA/SMA its a sell signal.
Green Circle shows that RSI is crossing above EMA/WMA/SMA etc, which means it may be a likely Buy Signal.
Red Circle shows that RSI is crossing below EMA/WMA/SMA etc, which means it may be a likely Sell Signal.
Indicator 11
RSI with Bollinger bands
Bollinger bands and RSI complimenting each other and giving a Buy and Sell signal in below chart
if a security price reaches upper band of a Bollinger Band channel and also the RSI is above 70 (overbought), a trader can look for selling opportunities (reversal) (sell).
but in case price reaches upper band of a Bollinger Band channel but RSI is not above 70 (overbought), there may be chance that security remains in an uptrend, so a trader may wait before entering a sell position.
if a security price reaches lower band of a Bollinger Band channel and also the RSI is below 30 (oversold), a trader can look for buying opportunities (reversal) (buy).
but in case price reaches lower band of a Bollinger Band channel but RSI is not below 30 (oversold), there may be chance that security remains in an downtrend, so a trader may wait before entering a buy position.
so bollinger band with RSI can give a double confirmation on a reversal.
Buy Signal = If the RSI is below Green Horizontal line (Oversold zone) and also below Lower Bollinger Band it indicates that an upside reversal may come, which means that it may be a likely Buy Signal.
Sell Signal = If the RSI is above Red Horizontal line (Overbought zone) and also above Upper Bollinger Band it indicates that an Downside reversal may come, which means that it may be a likely Sell Signal.
Special Thanks to //© HoanGhetti for RSI Trendlines.
Limitations of the RSI:-
RSI works best in range bound market and is less trustworthy in trending markets.
So new traders may get trapped in an uptrend or a downtrend if they forget to see the overall long term trend of that security.
Traders should set stop loss and take profit levels as per risk reward ratio.
Note:
Don't confuse RSI and relative strength. RSI is changes in the price momentum of a security.
whereas relative strength compares the price performance of two or more securities.
Like other technical indicators, RSI also is not a holy grail. It can only assist you in building a good strategy. You can only succeed with proper position sizing, risk management and following correct trading Psychology (No overtrade, No greed, No revenge trade etc).
THIS INDICATOR OF RSI IS FOR EDUCATIONAL PURPOSE AND PAPER TRADING ONLY. YOU MAY PAPER TRADE TO GAIN CONFIDENCE AND BUILD FURTHER ON THESE. PLEASE CONSULT YOUR FINANCIAL ADVISOR BEFORE INVESTING. WE ARE NOT SEBI REGISTERED.
Hope you all like it
happy learning.
Kioseff Trading - AI-Optimized RSIAI-Optimized RSI
Introducing AI-Optimized RSI: a streamlined solution for traders of any skill level seeking to rapidly test and optimize RSI. Capable of analyzing thousands of strategies, this tool cuts through the complexity to identify the most profitable, reliable, or efficient approaches.
Paired with TradingView's native backtesting capabilities, the AI-Optimized RSI learns from historical performance data. Set up is easy for all skill levels, and it makes fine-tuning trading alerts and RSI straightforward.
Features
Purpose : Uncover optimal RSI settings and entry levels with precision. Say goodbye to random guesses and arbitrary indicator use—this tool provides clear direction based on data.
Target Performance : You set the goal, and AI-RSI seeks it out, whether it's maximizing profits, efficient trading, or achieving the highest win rate.
AI-Powered : With intelligent AI recommendations, the tool dynamically fine-tunes your RSI approach, steering you towards ideal strategy performance.
Rapid Testing : Evaluate thousands of RSI strategies.
Dual Direction : Perfect both long and short RSI strategies with equal finesse.
Deep Insights : Access detailed metrics including profit factor, PnL, win rate, trade counts, and more, all within a comprehensive strategy script.
Instant Alerts : Set alerts and trade.
Full Customization : Test and optimize all RSI settings, including cross levels, profit targets and stop losses.
Simulated Execution : Explore the impact of limit orders and other trade types through simulation.
Integrative Capability : Combine your own custom indicators or others from the TradingView community for a personalized optimization experience.
Flexible Timeframes : Set your optimization and backtesting to any date range.
Key Settings
The image above shows explanations for a list of key settings for the optimizer.
Direction : This setting controls trade direction: Long or Short.
Entry Condition : Define RSI entry: Select whether to trigger trades on RSI crossunders or crossovers.
RSI Lengths Range : Choose the range of RSI periods to test and find the best one.The AI will find the best RSI period for you.
RSI Cross Range : Set the range for RSI levels where crosses trigger trade signals. The AI will find the best level for you.
Combinations : Select how many RSI strategies to compare.
Optimization Type : Choose the goal for optimization and the AI: profit, win rate, or efficiency.
Profit Target : Set your profit target with this setting.
Stop Loss : Decide your maximum allowable loss (stop loss) per trade.
Limit Order : Specify whether to include limit orders in the strategy.
Stop Type : Choose your stop strategy: a fixed stop loss or a trailing stop.
How to: Find the best RSI for trading
It's important to remember that merely having the AI-Optimized RSI on your chart doesn't automatically provide you with the best strategy. You need to follow the AI's guidance through an iterative process to discover the optimal RSI settings and strategy.
1.Starting Your Strategy Setup
Begin by deciding your goals for each trade: your profit target and stop loss. You'll also choose how to manage your stops – whether they stay put (fixed) or move with the price (trailing), and whether you want to exit trades at a specific price (limit orders). Keep the initial settings for RSI lengths and cross ranges at their default to give the tool a broad testing field. The AI's guidance will refine these settings to pinpoint the most effective ones through a process of comprehensive testing.
The image above shows our chart prior to any optimization efforts.
Note: the settings shown above in the key settings section will be used to start our demonstration.
2. Follow AI’s suggestions
Optimization Prompt: After loading your strategy, the indicator will prompt you to change the RSI length range and RSI level range to a better performing range.
Continue changing the RSI length range and RSI level range to match the indicator's suggestions until "Best Found" is displayed!
The image above shows results after we applied the tool’s suggestions. New suggestions have appeared, and we will continue to apply them.
Continue to adjust settings as recommended by the optimizer. If no better options are found, the optimizer will suggest increasing the number of combinations. Repeat this process until the optimizer indicates that the optimal setting has been identified.
Success! With the "Best Found" notification, an optimized RSI is now active. The AI will keep refining the strategy based on ongoing performance, ensuring continuous optimization.
AI Mode
AI Mode incorporates Heuristic-Based Adaptive Learning to fine-tune trading strategies in a continuous manner. This feature consists of two main components:
Heuristic-Based Decision Making: The algorithm evaluates multiple RSI-based trading strategies using specific metrics such as Profit and Loss (PNL), Win Rate, and Most Efficient Profit. These metrics act as heuristics to assist the algorithm in identifying suitable strategies for trade execution.
Online Learning: The algorithm updates the performance evaluations of each strategy based on incoming market data. This enables the system to adapt to current market conditions.
Incorporating both heuristic-based decision-making and online learning, this feature aims to provide a framework for trading strategy optimization.
Settings
AI Mode Aggressiveness:
Description: The "AI Mode Aggressiveness" setting allows you to fine-tune the AI's trading behavior. This setting ranges from “Low” to “High”, with “High” indicating a more assertive trading approach.
Functionality: This feature filters trading strategies based on a proprietary evaluation method. A higher setting narrows down the strategies that the AI will consider, leaning towards more aggressive trading. Conversely, a lower setting allows for a more conservative approach by broadening the pool of potential strategies.
Adaptive Learning Aggressiveness:
Description: When Adaptive Learning is enabled, the "Adaptive Learning Aggressiveness" setting controls how dynamically the AI adapts to market conditions using selected performance metrics.
Functionality: This setting impacts the AI's responsiveness to shifts in strategy performance. By adjusting this setting, you can control how quickly the AI moves away from strategies that may have been historically successful but are currently underperforming, towards strategies that are showing current promise.
Optimization
Trading system optimization is immensely advantageous when executed with prudence.
Technical-oriented, mechanical trading systems work when a valid correlation is methodical to the extent that an objective, precisely-defined ruleset can consistently exploit it. If no such correlation exists, or a technical-oriented system is erroneously designed to exploit an illusory correlation (absent predictive utility), the trading system will fail.
Evaluate results practically and test parameters rigorously after discovery. Simply mining the best-performing parameters and immediately trading them is unlikely a winning strategy. Put as much effort into testing strong-performing parameters and building an accompanying system as you would any other trading strategy. Automated optimization involves curve fitting - it's the responsibility of the trader to validate a replicable sequence or correlation and the trading system that exploits it.
Kioseff Trading - AI-Optimized Supertrend
AI-Optimized Supertrend
Introducing AI-Optimized Supertrend: a streamlined solution for traders of any skill level seeking to rapidly test and optimize Supertrend. Capable of analyzing thousands of strategies, this tool cuts through the complexity to identify the most profitable, reliable, or efficient approaches.
Paired with TradingView's native backtesting capabilities, the AI-Optimized Supertrend learns from historical performance data. Set up is easy for all skill levels, and it makes fine-tuning trading alerts and Supertrend straightforward.
Features
Rapid Supertrend Strategy Testing : Quickly evaluate thousands of Supertrend strategies to find the most effective ones.
AI-Assisted Optimization : Leverage AI recommendations to fine-tune strategies for superior results.
Multi-Objective Optimization : Prioritize Supertrend based on your preference for the highest win rate, maximum profit, or efficiency.
Comprehensive Analytics : The strategy script provides an array of statistics such as profit factor, PnL, win rate, trade counts, max drawdown, and an equity curve to gauge performance accurately.
Alerts Setup : Conveniently set up alerts to be notified about critical trade signals or changes in performance metrics.
Versatile Stop Strategies : Experiment with profit targets, trailing stops, and fixed stop losses.
Binary Supertrend Exploration : Test binary Supertrend strategies.
Limit Orders : Analyze the impact of limit orders on your trading strategy.
Integration with External Indicators : Enhance strategy refinement by incorporating custom or publicly available indicators from TradingView into the optimization process.
Key Settings
The image above shows explanations for a list of key settings for the optimizer.
Set the Factor Range Limits : The AI suggests optimal upper and lower limits for the Factor range, defining the sensitivity of the Supertrend to price fluctuations. A wider range tests a greater variety, while a narrower range focuses on fine-tuning.
Adjust the ATR Range : Use the AI's recommendations to establish the upper and lower bounds for the Average True Range (ATR), which influences the Supertrend's volatility threshold.
ATR Flip : This option lets you interchange the order of ATR and Factor values to quicky test different sequences, giving you the flexibility to explore various combinations and their impact on the Supertrend indicator's performance.
Strategies Evaluated : Adjust this setting to determine how many Supertrend strategies you want to assess and compare.
Enable AI Mode : Turn this feature on to allow the AI to determine and employ the optimal Supertrend strategy with the desired performance metric, such as the highest win rate or maximum profitability.
Target Metric : Adjust this to direct the AI towards optimizing for maximum profit, top win rates, or the most efficient profits.
AI Mode Aggressiveness : Set how assertively the AI pursues the chosen performance goal, such as highest profit or win rate.
Strategy Direction : Choose to focus the AI's testing and optimization on either long or short Supertrend strategies.
Stop Loss Type : Specify the stop loss approach for optimization—fixed value, a trailing stop, or Supertrend direction changes.
Limit Order : Decide if you want to execute trades using limit orders for setting your profit targets, stop losses, or apply them to both.
Profit Target : Define your desired profit level when using either a fixed stop loss or a trailing stop.
Stop Loss : Define your desired stop loss when using either a fixed stop loss or a trailing stop.
How to: Find the best Supertrend for trading
It's important to remember that merely having the AI-Optimized Supertrend on your chart doesn't automatically provide you with the best strategy. You need to follow the AI's guidance through an iterative process to discover the optimal Supertrend settings and strategy.
Optimizing Supertrend involves adjusting two key parameters: the Factor and the Average True Range (ATR). These parameters significantly influence the Supertrend indicator's sensitivity and responsiveness to price movements.
Factor : This parameter multiplies the ATR to determine the distance of the Supertrend line from the price. Higher values will create a wider band, potentially leading to fewer trade signals, while lower values create a narrower band, which may result in more signals but also more noise.
ATR (Average True Range) : ATR measures market volatility. By using the ATR, the Supertrend adapts to changing market volatility; a higher ATR value means a more volatile market, so the Supertrend adjusts accordingly.
During the optimization process, these parameters are systematically varied to determine the combination that yields the best performance based on predefined criteria such as profitability, win rate, or risk management efficiency. The optimization aims to find the optimal Factor and ATR settings.
1.Starting Your Strategy Setup
Begin by deciding your goals for each trade: your profit target and stop loss, or if all trades exit when Supertrend changes direction. You'll also choose how to manage your stops – whether they stay put (fixed) or move with the price (trailing), and whether you want to exit trades at a specific price (limit orders). Keep the initial settings for Supertrend Factor Range and Supertrend ATR Range at their default to give the tool a broad testing field. The AI's guidance will refine these settings to pinpoint the most effective ones through a process of comprehensive testing.
Demonstration Start: We'll begin with the settings outlined in the key settings section, using Supertrend's direction change to the downside as our exit signal for all trades.
2. Continue applying the AI’s suggestions
Keep updating your optimization settings based on the AI's recommendations. Proceed with this iterative optimization until the "Best Found" message is displayed, signaling that the most effective strategy has been identified.
While following the AI's suggestions, we've been prompted with a new suggestion: increase the
number of strategies evaluated. Keep following the AI's new suggestions to evaluate more strategies. Do this until the "Best Found" message shows up.
Success! We continued to follow the AI’s suggestions until “Best Found” was indicated!
AI Mode
AI Mode incorporates Heuristic-Based Adaptive Learning to fine-tune trading strategies in a continuous manner. This feature consists of two main components:
Heuristic-Based Decision Making: The algorithm evaluates multiple Supertrend-based trading strategies using metrics such as Profit and Loss (PNL), Win Rate, and Most Efficient Profit. These metrics act as heuristics to assist the algorithm in identifying suitable strategies for trade execution.
Online Learning: The algorithm updates the performance evaluations of each strategy based on incoming market data. This enables the system to adapt to current market conditions.
Incorporating both heuristic-based decision-making and online learning, this feature aims to provide a framework for trading strategy optimization.
AI Mode Settings
AI Mode Aggressiveness:
Description: The "AI Mode Aggressiveness" setting allows you to fine-tune the AI's trading behavior. This setting ranges from “Low” to “High”, with “High” indicating a more assertive trading approach.
Functionality: This feature filters trading strategies based on a proprietary evaluation method. A higher setting narrows down the strategies that the AI will consider, leaning towards more aggressive trading. Conversely, a lower setting allows for a more conservative approach by broadening the pool of potential strategies.
Optimization
Trading system optimization is immensely advantageous when executed with prudence.
Technical-oriented, mechanical trading systems work when a valid correlation is methodical to the extent that an objective, precisely-defined ruleset can consistently exploit it. If no such correlation exists, or a technical-oriented system is erroneously designed to exploit an illusory correlation (absent predictive utility), the trading system will fail.
Evaluate results practically and test parameters rigorously after discovery. Simply mining the best-performing parameters and immediately trading them is unlikely a winning strategy. Put as much effort into testing strong-performing parameters and building an accompanying system as you would any other trading strategy. Automated optimization involves curve fitting - it's the responsibility of the trader to validate a replicable sequence or correlation and the trading system that exploits it.
ONWAY Indicator PV6The ONWAY indicator is a comprehensive and earnestly designed tool aimed to increase confidence in a traders market bias. ONWAY analyzes market trends, market strength, and price action near key pivot levels to form a bias on future price action. Of course, it is fundamentally impossible to predict the future, but we all try it now don't we. Gain an edge in the markets and add ONWAY to your tool box.
ONWAY Functionality
Confirmation Signals: ONWAY provides real-time, non-repaint BUY and SELL signals upon the active timeframes candle close.
Targets and Stops: ONWAY will, upon signal confirmation, set a target and stop loss.
Position Management: ONWAY will monitor its current position, if one exists, and attempt to tighten the stop loss if possible.
ONWAY Details
Symbols and Timeframes: ONWAY is restricted to approved symbols and timeframes indicated by the 🟢 icon next to "Optimized:" and "ONWAY Timeframe:" on the dashboard. If an unapproved combination of symbol and timeframe is in use, ONWAY will be disabled (no signals will be visible). See author's instructions for the current ONWAY watchlist or to submit a symbol/timeframe request.
Position Details: Apart from the on chart signals and position plot, the ONWAY dashboard will indicate the current position, entry price, target price, and stop price.
Stop Loss: ONWAY has a unique stop loss/exit strategy that has proved, based on our calculations, to be advantageous. If price reaches or exceeds the stop loss, ONWAY will not close the position unless there is a candle close on the active timeframe exceeding the stop level. This is known as a soft stop loss and identified on the dashboard as "(Soft)" next to the stop price. Additionally, the stop loss will change throughout the position, following the low, for a long position or high, for a short position, within a given period, but the soft stop loss will not exceed beyond a 1:1 risk to reward ratio (the risk will always be equal to or less than the potential reward). It is importance to be aware that the soft stop is utilized at this 1:1 threshold as well. On the plus side, the changing stop loss will impose a risk free position if it finds itself between the entry price and target price. At this stage the soft stop is no longer utilized, the stop loss can only approach the target price, and profit is uhhh.....certain (I don't think the mods will like that word 😉). If the soft stop is no longer in use, the dashboard will indicate this with "(Hard)" next to the stop price.
Position Sizing: The position sizing used for the backtested results is displayed on the dashboard next to "Strategy Lot Size:". This position size is provided solely as a reference for the backtest results. The choice of a position size is left to the users discretion.
Backtest Results: With any strategy, backtesting is an excellent way to judge performance and viability, but it is important to recognize that past performance does not confirm repeatability in future market conditions.
Updates: ONWAY updates its acceptable symbols frequently to account for everchanging market conditions. This includes adding new symbols, rejecting previously compatible symbols, and modifying the optimal window for current symbols.
Acceptability Criteria: The criteria for a symbol to be deemed acceptable requires that its backtested results deliver a win rate greater than 70%, profit factor greater than 1.2, and its equity chart appear favorable. These metrics are available to users by clicking on "Strategy Tester" located on the bottom panel of the chart view.
Accessibility: To gain access to ONWAY, see the author's instructions below.
Use of this script implies that you acknowledge that past performance does not necessarily indicate future results and that guarantees are not possible in this trading realm.